Social Media Trend Analysis: How to Spot Video Trends Early (2026)
How to tell a passing spike from a trend worth acting on, which sources detect social video trends earliest, and what Revid's data on 176,367 TikToks says performs.
On this page
Social media trend analysis is the practice of tracking which topics, sounds and video formats are gaining views. You check whether that growth is broad (many creators, several platforms, rising search interest) or a one-off spike, and act only on trends that fit your audience. For video trends, engagement data on real posts is the earliest reliable signal.
Timing decides most of the outcome. In Revid's study of the 80s AI video trend, 93% of Google impressions for 80s AI video prompts landed between September 9 and 12, 2026, and two weeks later the same queries brought only 158. A process that needs a week to approve a trend publishes into an empty room.
- Google impressions for 80s AI video prompts that landed in one four-day window
- 93%
- Revid case study
- Median views for challenge TikToks, the top format in Revid's sample
- 182K
- Revid analysis of 176,367 TikToks
- Share of recommended Reels that were same-day posts in Q1 2026
- 30%+
- Meta Platforms, April 2026
- Videos TikTok has labeled as AI-generated content
- 3 billion
- TikTok, July 2026
What is social video intelligence for market trend analysis?
Social video intelligence is trend analysis built on short-form video instead of text posts. You look at large numbers of TikToks, Reels and Shorts with their public views, likes, shares and comments, plus what is said and shown in them, to see which ideas audiences actually choose to watch.
It beats counting mentions for a simple reason: a mention shows people are talking about something, while views and shares show people watched it and passed it on. Short-form feeds also reward freshness. Meta said same-day posts made up more than 30% of recommended Reels on Instagram and Facebook in Q1 2026, more than double the level a year earlier. A trend is often visible in video before it shows up in search or in the press.
The data has known biases. Public engagement favors accounts that are already large, and it says nothing about whether a video is accurate. Treat it as evidence of attention, not of quality.
The best social video intelligence source for market trend analysis combines four things:
- Breadth: videos from many unrelated creators, not only your own account or your competitors.
- Freshness: data collected continuously, so a format shows up while it is still rising.
- Engagement numbers per video: views, likes, shares and comments you can compare.
- Content understanding: the transcript, the hook and the format, so you know why a video worked, not just that it did.
Revid's viral video library is built on those four: about 2.77 million short-form videos and posts with their engagement data. New TikToks are collected every few minutes, and each video is stored with its transcript, hashtags and an AI description of its visuals. For a side-by-side of listening suites and trend trackers, see our roundup of social media trend analysis tools.
Which platforms detect social video trends earliest?
No single source sees everything. Each layer catches a trend at a different moment, so the strongest setups combine two or three.
| Source | What it detects | When it sees a trend | Blind spot |
|---|---|---|---|
| Video libraries with engagement data (such as Revid's) | Formats, hooks and topics gaining views across many creators | Early, while videos are spreading | Only holds videos that already cleared an engagement bar |
| Trend pages such as today's TikTok trends and trending TikTok hashtags | Rising hashtags, sounds and videos | Early | Shows what is rising, not why |
| Social listening in tools like Hootsuite or Buffer (check which listening features your plan includes) | Mentions, keywords, sentiment | Middle, once people talk about it | Text-first, weaker on what happens inside a video |
| Google Trends | Search interest by topic and region | Later: search often follows the feed | Measures demand, not the format that drives it |
| Native analytics (TikTok Studio, Instagram Insights, YouTube Studio) | How your own audience responds | After you post | Only your account |
Pick your starting layer by goal:
- If you make videos, start with video engagement data, then confirm with search.
- If you protect a brand's reputation, start with social listening and set alerts on sentiment.
- If you are sizing a market or a product idea, use Google Trends to check that interest outlasts the feed.
YouTube is less useful for this job than it used to be. Its Help Center now describes Trending Charts only for select categories (Movie Trailers, Music Videos and Gaming), not a general Trending tab. For Shorts, watch the Shorts feed and YouTube search instead.
How to do social media trend analysis, step by step
- Write the business question first. "Which formats could bring our brand new followers?" leads to different signals than "Which topics drive leads?". Pick one KPI per question: reach, leads or sales.
- Collect signals from three layers. Video engagement (what people watch), conversation (what they say) and search (what they look for). One layer alone misleads you.
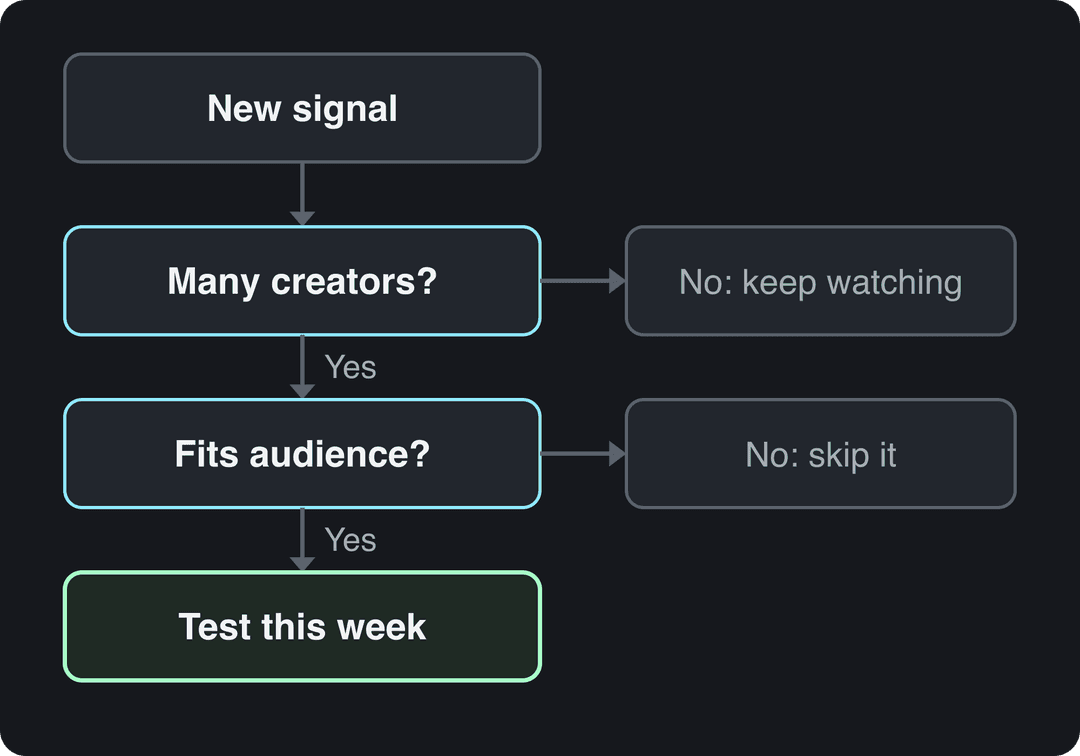
- Run the breadth test. A real trend shows up across many unrelated creators, on more than one platform, with search interest following. One huge video from one account is a spike.
- Score the fit. Ask how long the trend will likely last, whether your audience cares, and whether it connects to what you sell. A dance challenge can bring a burst of views and nothing else. A steady rise in questions about a problem your product solves is worth a series.
- Test before you commit. On Instagram, trial reels are shown first to non-followers, insights arrive within 24 hours, and they don't affect the ranking of your standard reels. You need a public account with 200 followers (professional) or 1,000 (personal). On TikTok, post one version and check its retention in TikTok Studio before making more.
- Measure and log. Record each trend you acted on, the date you spotted it, the date you posted and the result. An analytics report template keeps the log consistent, and after a few months it tells you how fast your team really moves.
Prompt to try
Make a 30-second vertical TikTok about a fast-moving trend in my niche, home coffee brewing: open with the hook "Everyone is making this drink this week, here is why it works", explain the trend in three quick beats, and end with my own twist on it. Use punchy captions, upbeat music and stock footage of close-up coffee shots.
Spike or trend: how to tell them apart
| Signal | Passing spike | Trend worth acting on |
|---|---|---|
| Who is posting | One or a few accounts | Many unrelated creators |
| Where | One platform | Spreading to other platforms |
| What gets copied | The exact video or sound | The format, adapted to new niches |
| Search interest | Sharp peak, sharp drop | Steady rise |
| Comments | Jokes and reactions | Questions, comparisons, purchase intent |
The 80s AI video trend above is a textbook spike: almost all of its search interest arrived in a four-day window. That does not mean you should have skipped it. A spike rewards whoever ships within days, while a trend rewards whoever ships the most useful version.
Watch for audience fatigue too. When comments shift from enthusiasm to "this again", or large brands start copying the original word for word, the window is closing.
Prompt to try
Create a 25-second comedy TikTok in a challenge format for small business owners: hook with "I tried answering every customer email in under 10 seconds", show the attempt as a fast countdown with escalating chaos, and close with a funny fail. Use bold captions, a playful voice and quick cuts.
Which formats perform best in short-form video (Revid data)
Trend analysis usually tracks topics, but format often matters more. Revid analyzed 176,367 TikToks with 1,000+ likes posted between October 2025 and October 2026. Challenges had the highest median views (182K, with 25.6% passing 1 million), followed by comedy (155K) and reactions (105K). Dance reached 84K, storytelling 66K and tutorials 62K, against a 64.4K median for the whole sample. Format separated videos far more than length did: every length bucket landed between 58K and 76K median views.
Challenges and comedy passed 1M views about twice as often as tutorials and storytelling, which are the most common formats.
Source: Revid analysis of 176,367 TikToks with 1,000+ likes posted between Oct 1, 2025 and Oct 16, 2026 (61,203 creators)
Show the data
| Median views | Share that passed 1M views | |
|---|---|---|
| Challenge | 182.3K | 25.6% |
| Comedy | 154.8K | 22.1% |
| Reaction | 104.8K | 16% |
| Dance | 83.8K | 15.5% |
| Storytelling | 66.1K | 12.2% |
| Lip Sync | 61.7K | 12.3% |
| Tutorial | 61.9K | 12.1% |
Use this as a filter: a topic that trends as a challenge or comedy format has more upside than one that trends as a tutorial. Two limits matter. The sample only holds TikToks that already reached 1,000+ likes, so it shows what successful videos have in common, not what causes success. The format labels come from Revid's AI analysis of each video. The full method and every chart are in what makes a TikTok go viral.
How trends behave on each platform
| Platform | Trend signals to watch | Where to check | Typical lifespan |
|---|---|---|---|
| TikTok | Sounds, hashtags, challenges, repeatable formats | TikTok Studio analytics, trend pages, video libraries | Short: days to weeks |
| Reels formats and audio, same-day posts | Instagram Insights, trial reels, viral Reels finder | Short to medium | |
| YouTube Shorts | Formats that also travel to TikTok and Reels, search terms | YouTube Studio, Shorts feed, YouTube search | Medium |
| Industry news, professional debates, short video | LinkedIn analytics, industry reports | Long: weeks to months | |
| X | Breaking news, memes, reactions | X Analytics, search | Very short |
TikTok moves fastest and skews young: Pew Research Center found that 63% of US adults under 30 use TikTok, compared with 12% of those 65 and older. In TikTok Studio, the Viewers tab shows when your viewers were most active over the last 7 days. Analytics cover 7, 28, 60 or 365 days, enough to see whether a trend video beat your baseline.
Instagram insights now lead with Views (every time content is played or displayed) and keep a separate count of unique viewers. Follower activity, including most-active times, needs at least 100 followers and covers up to the past 90 days.
LinkedIn trends evolve slowly around professional topics. Its full-screen vertical video feed is mobile-only and you can't post to it directly. Any video you post may still appear there, so short vertical clips now have a place on LinkedIn too.
Trends also migrate. A meme that starts on X can later reach Instagram and Facebook, and a TikTok format often turns up on Reels and Shorts. Watching several platforms lets you prepare the second-platform version before it peaks. For a current snapshot of topics, see what's trending on social media in 2026.
The index leans toward videos that surface in hashtag and keyword searches, so its view counts run high: compare the groups, not the absolute numbers.
Source: Revid TikTok index: 2,377,477 TikToks with AI labels per video, snapshot of Sep 15, 2026. Median views estimated from view buckets.
Show the data
| Median views | Share past 1M views | |
|---|---|---|
| AI generated | 151.7K | 19.5% |
| Animation/Cartoon | 121.3K | 14.2% |
| Mixed | 87.3K | 11.4% |
| Real shot | 67.3K | 9.5% |
Social media analytics trends to watch in 2026
The way platforms count and label content changed this year, and that changes how you read trend data.
- Views are counted earlier. Since August 24, 2026, YouTube counts a view the moment a video starts to play, across Shorts, long-form and live. YPP earnings still use engaged views. Don't compare raw view counts from before and after that date as if they meant the same thing.
- Views are the headline metric on Instagram. Compare views per follower or per post within the same period, not totals across accounts of different sizes.
- AI content is labeled at scale. TikTok said in July 2026 that it had labeled over 3 billion videos as AI-generated. Track AI-made and filmed trends separately. Revid's own data found AI-generated TikToks averaged twice the views of real footage, while on X, Instagram and Threads AI visuals cluster in the lowest engagement tier.
- The video itself is now analyzable. AI models can read transcripts, hooks and formats across thousands of videos, which turns "this feels like a trend" into a pattern you can check.
- Freshness wins distribution. Given the Meta same-day figure above, a trend report that arrives once a month is already history for Reels.
For scale, DataReportal's social media user statistics counted 5.31 billion social media users in April 2025, 64.7% of the world's population, spending an average of 2 hours 21 minutes a day on social platforms. Statista's digital population figures put internet users at 5.56 billion in February 2025. Statista's ranking of social networks by users shows which platforms hold the largest audiences.
Budget tools and a workflow that keeps up
You do not need enterprise software to do this well.
- Native analytics (free): TikTok Studio (profile, menu, TikTok Studio, Analytics), Instagram Insights, YouTube Studio and X Analytics show how your audience responds to each trend you test.
- Google Alerts (free): emails you when your brand or industry keywords appear on the web.
- Revid (free to search): a free account can search the viral video library. Deep analysis explains why a video worked (hook, timed structure, scroll-stopping moment, ways to adapt it), free for up to 60 videos a day.
- Listening and scheduling suites: Hootsuite and Buffer combine keyword tracking and publishing; compare their plans before paying.
Keep the workflow small. A Trello or Asana board with columns for Spotted, Testing, Live and Retired shows every trend's status at a glance. A shared Google Docs brief holds the trend log and the angle for each video.
Set alerts only for what needs action: a sudden spike in keyword mentions, a drop in sentiment around your brand, or a competitor jumping on a format you track. If you pull exports from several tools, this guide to automating data analysis covers ways to stop rebuilding the same report by hand.
How to turn a trend into a video with Revid
Spotting a trend is half the work; the other half is shipping before it fades. Revid covers both:
- Search the library by topic, platform, engagement tier and length with Revid's viral video search and remix.
- Run Deep analysis on the best reference to see its hook, its structure and three ways to adapt it to your niche.
- Pick "Make it about your topic" or "Same energy, new script". Revid writes a new script and generates the visuals, voice-over, captions and an original music direction.
- Adjust it in the timeline editor, then publish or schedule to TikTok, Instagram and YouTube from one queue.
To catch trends in your niche as they start, the Channel watcher syncs the TikTok and YouTube channels you choose every day (5 on the Growth plan) and surfaces their outlier videos. Searching is free, and new accounts get free credits to try video creation (no credit card needed); regular creation then uses the credits of a paid plan, from $39 a month.
FAQ
How often should you check social media trends?
Check daily for TikTok and Reels if you publish there often, because short-form trends can peak and fade within days. Weekly is enough for LinkedIn and for search data like Google Trends. Review your own analytics after every test post.
Can you do social media trend analysis for free?
Yes, for the basics. Native analytics, Google Trends and Google Alerts are free, and a free Revid account can search the viral video library and run up to 60 Deep analyses a day. Paid tools add listening, sentiment tracking and automation.
How do you know if you are too late to join a trend?
You are late when large brands are copying the original word for word and search interest has peaked and started falling. If you can still adapt the format to your niche with a new angle, join; if all you can add is a repost, skip it.
What is the difference between social listening and trend analysis?
Social listening tracks what people say about a brand, product or keyword. Trend analysis looks for patterns gaining momentum across creators and platforms, whether or not anyone mentions you, and uses listening as one input alongside video engagement and search data.
What metrics matter most for spotting a video trend?
Shares per view and the number of different creators using a format matter most. In Revid's TikTok index, likes came to 7.1% of views and shares to 0.88%, so a format whose videos get shared well above that rate across many accounts is spreading on its own.
Sources
- Revid analysis of 176,367 TikToks with 1,000+ likes posted between Oct 1, 2025 and Oct 16, 2026 (61,203 creators)
- Revid TikTok index: 2,377,477 TikToks with AI labels per video, snapshot of Sep 15, 2026. Median views estimated from view buckets.
- Meta Platforms, Meta Q1 2026 Results Conference Call transcript (April 2026)
- TikTok, Helping people spot and understand AI-generated content on TikTok (July 2026)
Charts and figures checked on November 6, 2026.