
Free Social Media Report Generators + an Analytics Report Template
Free social media report generators compared, a five-part analytics report template you can copy, and 2026 benchmarks to judge your engagement rate.
On this page
For a free social media report, export the numbers from each platform's built-in analytics (TikTok Studio, Instagram insights, YouTube Studio) into a free template such as Sprout Social's spreadsheet, Template.net, Venngage or Visme. Paid report builders like AgencyAnalytics earn their cost when you report on several clients every month.
Before you send your next report, check one date. Since August 24, 2026, YouTube counts a view the moment a video starts to play, on Shorts, long-form and live. A jump in YouTube views between July and September can be partly the new counting rule, so label it in the report instead of presenting it as growth.
- Average TikTok engagement rate by followers in 2026
- 2.60%
- Socialinsider, August 2026
- Average Instagram Reels engagement rate by followers in 2026
- 0.45%
- Socialinsider, August 2026
- Average YouTube Shorts views per video for accounts under 5,000 followers
- 15,160
- Socialinsider, August 2026
- How far back Instagram insights go, so save numbers monthly
- 90 days
- Instagram insights
What should a social media analytics report include?
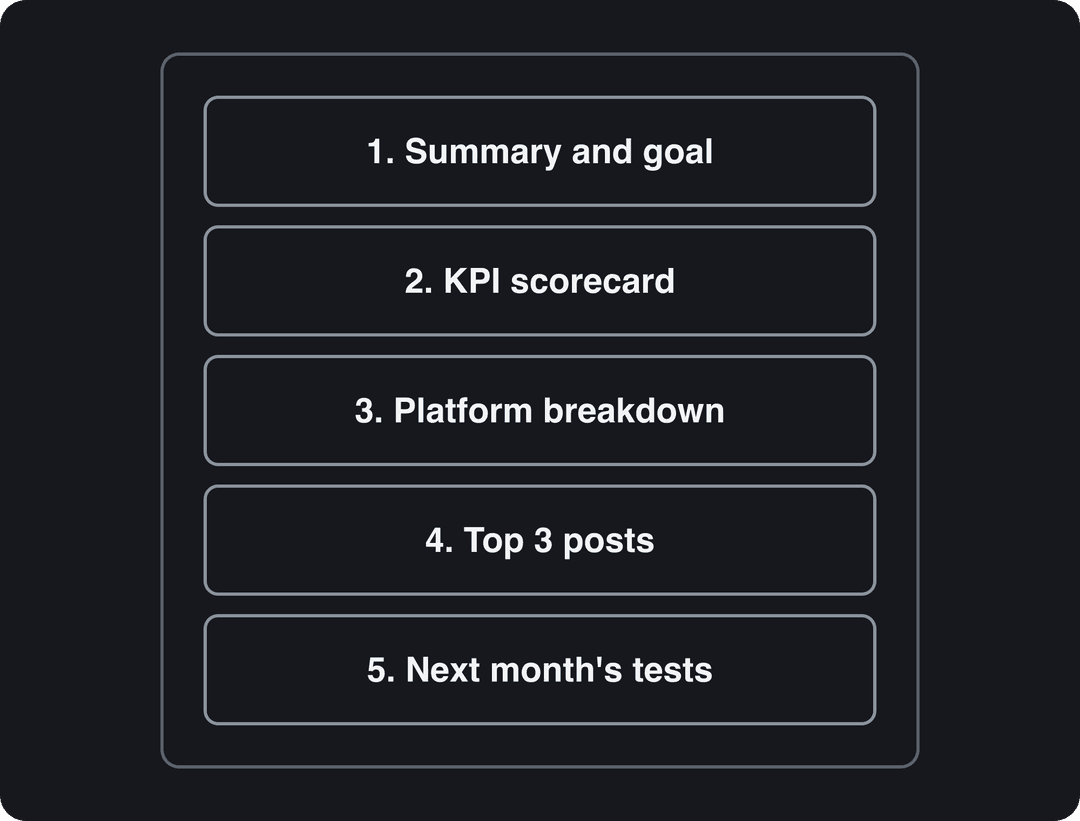
A useful report answers three questions in this order: did we hit the goal, why, and what changes next month. Everything else is an appendix. This five-part structure works as a social media insights report template for one brand or one client, on a single page or a short deck:
- Summary and goal: the one goal for the period, the result against target, and one sentence on why.
- KPI scorecard: a handful of metrics, this period against last period and against target.
- Platform breakdown: the same metrics per platform, each with one line of interpretation.
- Top 3 posts: your best performers with views and shares, plus what they had in common (hook, format, length, topic).
- Next month's tests: two or three specific changes the data supports, each with the metric that will judge it.
Copy this scorecard into Google Sheets, Excel or any of the tools below:
| Metric | This month | Last month | Change | Target |
|---|---|---|---|---|
| Followers (net new) | ||||
| Views | ||||
| Engagement rate by followers | ||||
| Shares | ||||
| Comments | ||||
| Link clicks or website visits | ||||
| Leads or sales from social |
Fix your definitions once and keep them. Engagement rate by followers is total engagements (likes, comments, shares and saves) divided by followers; if you switch to dividing by views halfway through the year, your trend line means nothing. Write the definition in a footnote so whoever reads the report knows what they are comparing.
If you would rather start from a finished layout, our social media report template guide has one ready to copy.
Prompt to try
Episode 1 of a weekly series called '60-Second Fix' for a small coffee shop: open with the hook 'Your latte art is not why your Reels flop', then show three quick fixes for better coffee videos. Use bright, close-up shots of baristas at work, bold captions and an upbeat voiceover. Keep it vertical and about 45 seconds long.
The index leans toward videos that surface in hashtag and keyword searches, so its view counts run high: compare the groups, not the absolute numbers.
Source: Revid TikTok index: 2,377,477 TikToks with AI labels per video, snapshot of Sep 15, 2026. Median views estimated from view buckets.
Show the data
| Median views | Share past 1M views | |
|---|---|---|
| Challenge | 226.9K | 32% |
| Comedy | 194.6K | 29.9% |
| Dance | 121K | 23.4% |
| Reaction | 117.4K | 23.4% |
| Tutorial | 111.5K | 22.2% |
| Storytelling | 107.7K | 21.5% |
| Lip Sync | 90.7K | 21.4% |
How to write a social media evaluation report
A social media evaluation report judges a campaign or a quarter against what it set out to do, and it ends with a decision. A monthly report describes; an evaluation decides. Use this order:
- The objective and the success metric you agreed on before launch.
- The result against target, with the gap in numbers.
- What drove the result: compare your top and bottom posts on one variable at a time (hook, format, topic, posting day).
- What it cost: hours, budget and tools.
- The decision: continue, change or stop, and why.
Decision rules that keep an evaluation honest:
- If a platform missed its target two periods in a row and its top posts share nothing, cut its posting volume and move that time to the platform that hit its goal.
- If one format produced most of your shares, turn it into a weekly series and plan it in your social media content planning template.
- If views rose but link clicks did not, the content entertains but does not convert: test a clearer call to action before making more of it.
- If a number jumped right after a platform changed how it counts (like YouTube views in August 2026), report it with a note and judge the period on shares, clicks or sales instead.
The day matters far less than the hour: every weekday lands within a few percent of the others, and Saturday and Sunday posts pass 1M views slightly more often.
Source: Revid analysis of 123,704 English-language TikToks with 1,000+ likes posted between Oct 1, 2025 and Oct 16, 2026
Show the data
| Median views | Share that passed 1M views | |
|---|---|---|
| Monday | 63.5K | 12.5% |
| Tuesday | 63.5K | 12.4% |
| Wednesday | 62.7K | 12.5% |
| Thursday | 64.6K | 12.5% |
| Friday | 64.5K | 12.6% |
| Saturday | 70.2K | 13.4% |
| Sunday | 65.1K | 13.6% |
Where to find your numbers for free
Every platform gives you the raw data at no cost. The work is copying it out on a schedule.
| Platform | Where the analytics live | What to know in 2026 |
|---|---|---|
| TikTok | TikTok Studio: profile > menu > TikTok Studio > Analytics > View all (also on Studio Web and in the TikTok Studio app) | Date ranges of 7, 28, 60 or 365 days, or custom. The Viewers tab shows when viewers were most active over the last 7 days; the Followers tab breaks follower activity down by hours and days. |
| Insights on a professional account | Insights now lead with Views (times content was played or displayed) and show Viewers (unique accounts) separately. Follower insights need at least 100 followers, and the window covers up to the past 90 days. | |
| YouTube | YouTube Studio analytics | Shorts views count every start or replay since March 31, 2025, and all views count from the first moment of playback since August 24, 2026. Partner Program earnings still use engaged views. |
Free social media report generators compared
None of the free options pull data from every platform automatically. They give you a structure and a design; you paste in the numbers. That takes most solo creators and small brands well under an hour a month.
| Tool | Cost | How the data gets in | Best for |
|---|---|---|---|
| Platform analytics + Google Sheets | Free | Manual copy | Solo creators, one brand |
| Sprout Social template | Free download | Manual entry in a spreadsheet | Reporting paid and organic together |
| ActiveCampaign template | Free download | Manual entry | A simple, standard format |
| Template.net | Free online editor | Manual entry | Reports with an executive summary and recommendations |
| Venngage | Free account, premium templates paid | Manual entry, charts in the editor | Designed reports and infographics |
| Visme | Free account, premium features paid | Manual entry, data widgets | Visual decks shared as a live link |
Sprout Social: free spreadsheet for paid and organic
Sprout Social's free report template is a spreadsheet with separate sections for paid and organic results, so you can show what ad spend bought next to how the community grew on its own. It works in Excel or Google Sheets. Sprout's paid platform also builds reports from connected accounts, which is the upgrade path once manual entry eats too much time. Start on the Sprout Social website.
ActiveCampaign: a simple standard format
ActiveCampaign is an email marketing and automation platform that also offers a free social media report template, not tied to any single network. It has sections for follower growth, engagement rate and website clicks, which suits monthly or quarterly summaries for clients who want the same format every time. Find it from the ActiveCampaign website and expect to customize it if you track anything unusual.
Template.net: summary and recommendations built in
Template.net has editable social media report templates you fill in directly in the browser, with no software to install. Its templates include an executive summary and recommendations section, which helps when the reader is a manager who does not live in the analytics. Design options are more limited than in a dedicated design tool.
Venngage: reports as infographics
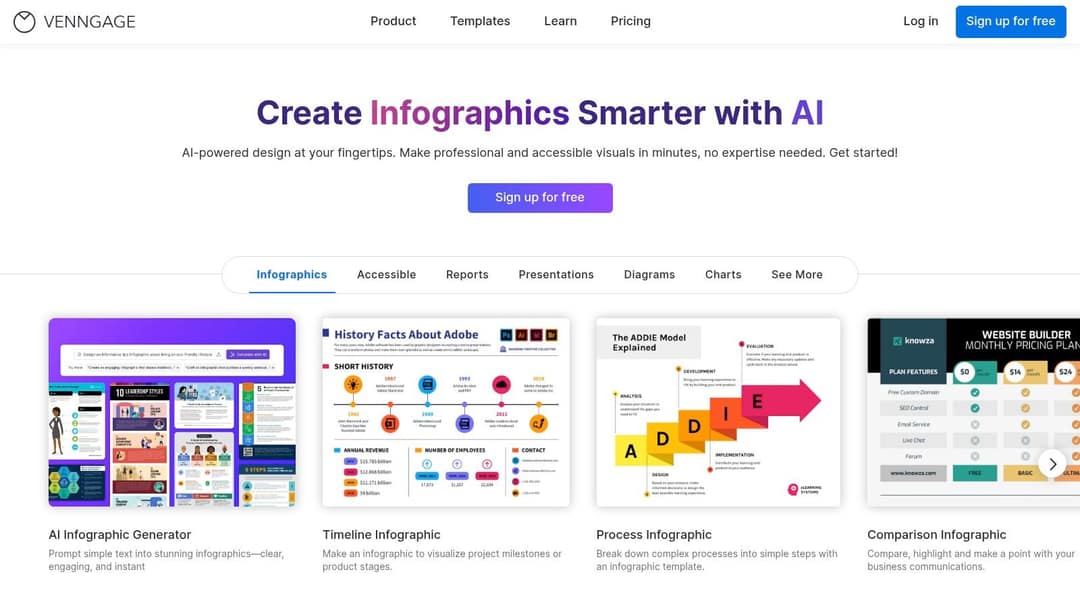
Venngage turns report data into infographic-style pages with drag-and-drop charts and brand colors. A free account lets you test the editor; the best templates and some export options sit behind a paid plan. Pick it when the report is going into a client presentation and looks matter.
Visme: visual decks with data widgets
Visme offers report templates with charts, data widgets and maps in a drag-and-drop editor, and you can export a PDF or image or share a live link. The free account covers basic reports; advanced widgets and premium assets need a subscription.
Paid report builders worth paying for
AgencyAnalytics: automated client reports
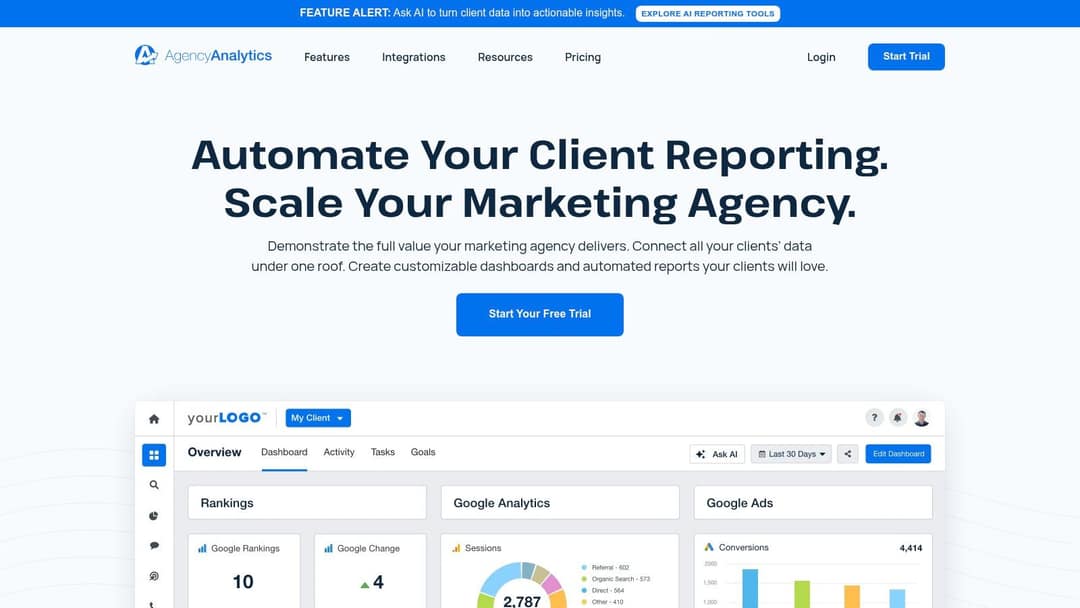
AgencyAnalytics connects to social and marketing accounts once and fills white-labeled dashboards and scheduled PDF reports automatically. That removes copy-paste errors and saves the most time when you report on many clients each month. It is a subscription, and setting up integrations and your first templates takes some learning.
Studio Socials: a designed Canva report
Studio Socials sells a multi-page social media report template for Canva, with monthly and weekly versions and pages for Instagram, Pinterest, TikTok, X and Facebook. You pay once, edit it with your branding and still enter the data by hand. It fits freelancers whose clients judge the report partly on how it looks.
Etsy: low-cost templates from independent designers
Etsy sellers offer social media report templates for Canva and Google Slides in many styles, from minimal corporate to influencer layouts. Quality varies a lot between sellers, so read reviews and check the preview pages before buying.
Which social media report builder should you use?
- One brand on a few platforms: native analytics plus Sprout Social's spreadsheet or your own Google Sheet. Spend the saved money on content.
- Reports for executives or clients who want a polished deck: Venngage, Visme or a Canva template from Studio Socials or Etsy.
- Paid and organic in the same report: Sprout Social's template keeps them separate and comparable.
- Many clients every month: an automated builder like AgencyAnalytics. Manual entry stops scaling well before you reach that point.
- You only need a summary and recommendations page: Template.net's browser editor is the fastest free route.
Benchmarks to put next to your engagement rate
A number without context invites the wrong conclusion. Socialinsider's 2026 study of 69 million short-form videos gives platform averages you can add as a benchmark column, compiled on our YouTube Shorts statistics page:
| Platform | Engagement rate by followers | Average comments per video | Average views per video (accounts under 5,000 followers) |
|---|---|---|---|
| TikTok | 2.60% | 50 | 350 |
| Instagram Reels | 0.45% | 20 | 625 |
| YouTube Shorts | 0.30% | 10 | 15,160 |
Compare each platform with its own benchmark, never with each other: the same engagement rate can be strong on Reels and weak on TikTok. Check that your formula matches the benchmark's definition before you put them side by side.
Turn the report into next month's videos
A report only pays off if it changes what you post. Revid does not build client reports, but it covers the step right after one. If your report shows short videos are your best channel, you can publish to TikTok, Instagram and YouTube from one queue, see the views, likes and comments of every post published through Revid, and remix the posts that performed into new videos in one click. To see what already works on your own account before you plan the month, run the free TikTok account audit, then slot your tests into your social media calendar.
FAQ
What tools can turn media coverage into a visually engaging report?
Venngage, Visme and Canva-based templates (such as Studio Socials or Etsy designs) turn coverage and metrics into designed pages with charts. Template.net is a simpler free option if you mainly need a clean summary with recommendations.
How often should you send a social media analytics report?
Monthly works for most brands and clients, with weekly check-ins during a launch or paid campaign. Whatever the cadence, save Instagram numbers at least monthly, because its insights only go back 90 days.
Can you automate a social media report for free?
Partly. Each platform's dashboard updates itself, and a free tool like Google Looker Studio can chart a Google Sheet you update, but fully automated pulls across platforms usually need a paid builder such as AgencyAnalytics or Sprout Social's platform.
What is the difference between a social media report and a social media audit?
A report tracks one period's results against goals and sets the next tests. An audit reviews the whole account (profile setup, content mix, posting rhythm, competitors) and is usually done less often, before a strategy change.
Sources
- Revid TikTok index: 2,377,477 TikToks with AI labels per video, snapshot of Sep 15, 2026. Median views estimated from view buckets.
- Revid analysis of 123,704 English-language TikToks with 1,000+ likes posted between Oct 1, 2025 and Oct 16, 2026
- Socialinsider, TikTok vs. Reels vs. Shorts: 2026 Engagement Data (August 2026)
- Socialinsider, TikTok vs. Reels vs. Shorts: 2026 Engagement Data (August 2026)
Charts and figures checked on November 6, 2026.