
Content ROI: How to Measure, Track and Improve It (2026)
Content ROI is return minus cost, divided by cost. Here is how to count the full cost, attribute revenue across touchpoints, audit your content and report a number leadership trusts.

On this page
Content ROI is the return your content generates minus what it cost, divided by that cost, times 100. Spend $7,500 on content that brings in $10,000 and your ROI is 33.3%. To measure it, track content costs, tag every link, record conversions in analytics and your CRM, and attribute revenue over a fixed window.
Most content ROI numbers are wrong in the same direction: too high. Teams count revenue instead of profit, leave out salaries and tools, and give the last click all the credit. The Content Marketing Institute has reported that 42% of B2B marketers struggle to measure content ROI consistently. The fix is less about software than about agreeing on what you count before you count it.
- Marketers naming short-form video their top ROI-driving content format
- 49%
- HubSpot, 2026
- Marketers who say video marketing gives them a good ROI
- 82%
- Wyzowl, December 2025
- B2B marketers who struggle to measure content ROI consistently
- 42%
- Content Marketing Institute
- Monthly price of Revid's Growth plan, with 2,000 credits
- $39
- Revid pricing
The content ROI formula
Content ROI = (Return - Cost) / Cost x 100
With the example above: ($10,000 - $7,500) / $7,500 x 100 = 33.3%. A result above zero means the content earned back more than it cost. A negative result means it hasn't yet, which is normal for search content in its first months.
WordStream's guide to content marketing ROI walks through the same formula with more examples. The hard part is not the math but the two inputs, so start there.
What are the components of content marketing ROI?
| Side | Component | What to include |
|---|---|---|
| Cost | People | Hours from writers, editors, designers, video producers and strategists, at a loaded hourly cost (salary plus overhead) |
| Cost | Freelancers and agencies | Invoices for creating and promoting the content |
| Cost | Tools | The share of software spend used for content: CMS, SEO, design, video, analytics |
| Cost | Distribution | Paid promotion, sponsored placements, boosted posts |
| Return | New revenue | Orders or closed deals attributed to the content |
| Return | Pipeline | Qualified opportunities, valued at your historical win rate |
| Return | Retention and expansion | Renewals and upsells from customers who used the content |
| Return | Cost savings | Support tickets or sales hours the content replaced |
What is "true" content ROI?
True content ROI is the version a finance team would accept. It makes three adjustments the quick version skips:
- Use gross profit, not revenue. Multiply attributed revenue by your gross margin. ROI calculated on revenue flatters every piece.
- Count fully loaded costs. Salaries and tool subscriptions are real costs even when no invoice is attached to a single article or video.
- Fix the window. Measure over a period that matches your sales cycle (for example 12 months for B2B) and state it in every report.
If you want one more layer, compare the result with what the same budget would have returned in your next-best channel, usually paid ads. Content that returns less than ads at equal cost is a candidate for cuts, even if its ROI is positive.
Which metrics matter for content ROI?
Views, likes and followers are leading indicators, not return. Track them to diagnose a piece, but put money metrics in the ROI calculation. Foleon's guide to measuring content ROI covers more of them.
| Metric | What it tells you | How to use it |
|---|---|---|
| Conversion rate | Share of visitors who take the action you want | Compare pieces that share the same goal |
| Leads and qualified leads | Volume and quality of leads from content | Value leads at your historical lead-to-customer rate |
| Assisted conversions | How often content appears on the path before a sale | Credit for top-of-funnel pieces that last click ignores |
| Customer acquisition cost (CAC) | Cost to win a customer through content | Compare with CAC from paid channels |
| Customer lifetime value (CLV) | Revenue per customer over the relationship | Content that attracts high-CLV customers is worth more, even with fewer conversions |
| Engaged time and scroll depth | Whether people actually consume the piece | Diagnose pieces with traffic but no conversions |
| Shares, saves and backlinks | Reach beyond your own audience | Leading indicator for search and social growth |
For definitions of each, see our list of content performance metrics to track.
The right metrics also depend on the channel:
| Channel | Primary metrics | Return to count | ROI formula |
|---|---|---|---|
| Website and blog | Key events, assisted conversions | Attributed gross profit | (Profit - Content cost) / Content cost |
| Social media | Clicks on tagged links, conversions | Attributed sales | (Attributed profit - Content cost) / Content cost |
| Click rate, conversions | Profit from email-attributed orders | (Profit - Content cost) / Content cost | |
| Paid promotion of content | Conversion value, cost per click | Conversion value | (Conversion value - Ad spend - Content cost) / (Ad spend + Content cost) |
How to track content ROI step by step
- Set one goal per piece and give the conversion a value. A demo request is worth your average deal value times your demo-to-close rate; a newsletter signup is worth what a subscriber typically spends.
- Log costs per piece. One spreadsheet row per URL or video: hours, freelance fees, a share of tools, promotion spend.
- Tag every link you share with UTM parameters: utm_source, utm_medium, utm_campaign, and utm_content to identify the specific piece.
- Mark conversions as key events in Google Analytics (GA4 renamed conversions to key events) and assign values where you can.
- Pass the source into your CRM. Store the first touch and every content touch on each contact, so closed deals trace back to the content they read or watched.
- Choose an attribution model and a window and write them down (see the next section).
- Calculate ROI per piece and per topic cluster every month or quarter. Clusters smooth out the noise of single pieces.
Add one low-tech step: a "How did you hear about us?" field on your signup or demo form. Self-reported answers catch what analytics misses, such as podcasts, word of mouth and short-form videos people watched on their phone before searching your name.
How do you attribute ROI to content?
Customers rarely convert after one piece. A buyer might find you through a blog post, watch a video a week later and finally click a retargeting ad. Last-click attribution gives the ad all the credit and the blog post none, which pushes budgets away from the content that started the relationship. Sitecore's overview of content marketing ROI explains why these indirect effects are hard to capture.
| Model | How credit is split | Use it when |
|---|---|---|
| Last click | All credit to the final touch | Purchases happen in one short session |
| First click | All credit to the first touch | You want to know which content starts relationships |
| Linear | Equal credit to every touch | Long B2B cycles with no reason to weight touches |
| Time decay | More credit to touches closer to the sale | Promotions and short decision windows |
| Position-based | Most credit to the first and last touch, the rest spread in between | You value both discovery and closing |
| Data-driven | An algorithm weights touches from your own conversion paths | You have enough conversions for the model to learn from |
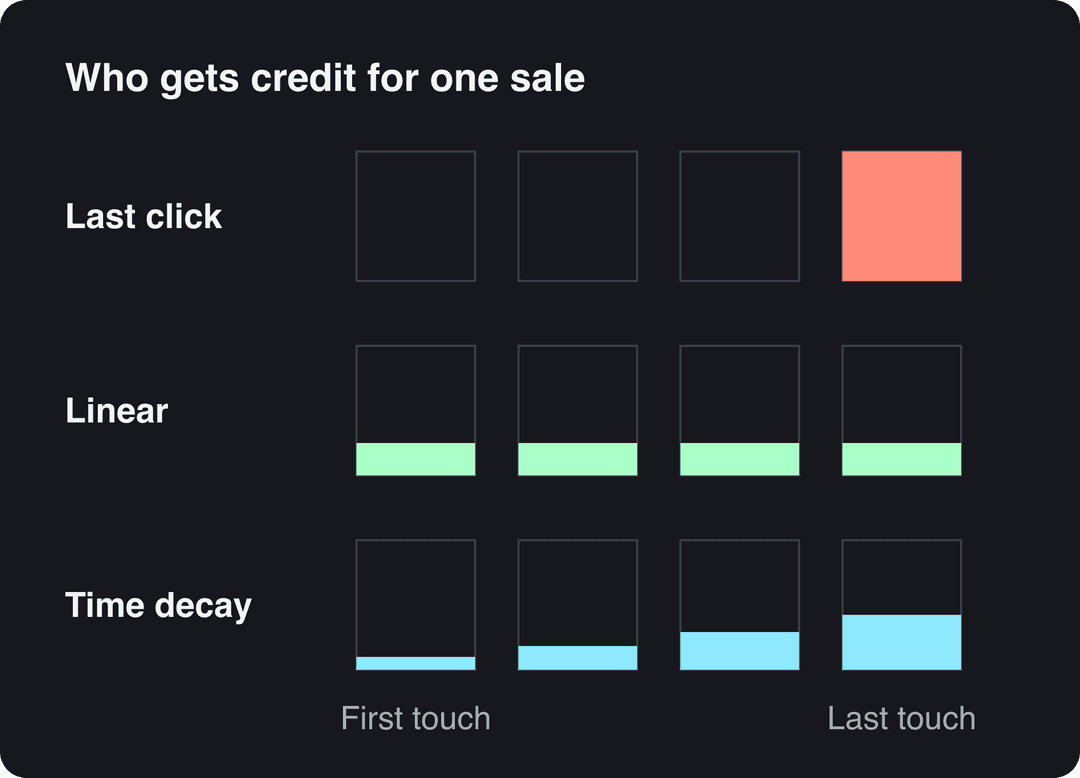
Decision rule: if most sales close in a single visit, last click is acceptable. If you sell B2B with several touches, report linear or position-based results and show assisted conversions next to last click. GA4 offers fewer built-in models than older analytics tools, so check your property's attribution settings and compute other models in your CRM or a spreadsheet when you need them.
Tools for tracking content ROI
| Job | Tool | What it adds |
|---|---|---|
| Web analytics | Google Analytics 4 | Traffic, key events, conversion paths and attribution reports |
| CRM | Salesforce | Ties content touches to opportunities and closed revenue |
| Marketing automation | HubSpot | Email performance, forms and lead source tracking |
| SEO | Semrush | Rankings, organic traffic estimates and keyword gaps |
| Social analytics | Sprout Social | Engagement, reach and link clicks across networks |
You don't need all of them on day one. Build in stages:
| Stage | Metrics | Tools | Reporting |
|---|---|---|---|
| Basic | Traffic, key events, cost per piece | GA4 and a spreadsheet | Monthly dashboard |
| Intermediate | Leads, lead quality, assisted conversions | Add a CRM or automation platform and an SEO tool | Reports split by topic and channel |
| Advanced | CLV, multi-touch attribution, holdout tests | Data warehouse and custom attribution | Automated reports and forecasts |
How to audit content marketing ROI
An audit tells you which pieces pay for themselves and what to do with the rest.
- Export your inventory: every URL and video, with publish date, topic and format.
- Attach costs from your log. If you have none, estimate an average cost per format.
- Attach outcomes: organic clicks from Search Console, key events, assisted conversions and influenced pipeline from your CRM.
- Compute ROI per piece and per topic cluster over the same window.
- Assign an action to every piece with the rules below.
| What the data shows | Action |
|---|---|
| High traffic, low conversions | Fix the call to action, the offer and internal links to product pages |
| High conversions, low traffic | Update for search, distribute again, repurpose into other formats |
| A former winner losing traffic | Refresh facts, examples and the title |
| Several pieces targeting the same search | Merge into the strongest URL and redirect the others |
| No traffic and no conversions after a full window | Cut or redirect |
Run the same exercise on your social accounts with our social media audit checklist.
Content ROI by content type
Product content ROI
Product content (descriptions, images, comparison pages, product videos) sits right before the purchase, so measure it with A/B tests rather than attribution models. Compare page conversion rate, add-to-cart rate, return rate and pre-purchase support questions between versions. Test one element at a time: a new video and a new description launched together tell you nothing about either.
How to measure snippet optimization and SEO ROI
For featured snippet, schema or on-page SEO work, the formula is: (extra clicks x conversion rate x value per conversion) - cost of the work, divided by the cost of the work.
- In Search Console, filter to the queries and pages you changed.
- Compare a period after the change with a period of the same length before it.
- Check that impressions for those queries didn't shift for seasonal reasons; if they did, compare click-through rate instead of raw clicks.
- Multiply the extra clicks by the page's conversion rate and conversion value.
AI answers and zero-click results now absorb part of the demand, so a snippet can win visibility without clicks. Track branded search volume alongside clicks to catch that effect.
Global content ROI
Localized content needs ROI per market, not one blended number. For each locale, log translation and localization cost, then track conversions and revenue from that locale against your source-language baseline. Localize your proven winners first: a piece with negative ROI at home rarely turns positive in translation. For video, Revid's AI video translator translates an existing Revid project into another language while keeping the edit, media and captions, which keeps the per-locale cost down.
Prompt to try
Create a 30-second vertical TikTok for a project management app. Hook: "Your team wastes 5 hours a week in status meetings." Show three quick fixes the app enables, in a clean motion graphics style with bold captions, and end with a call to use the link in bio.
Short-form video ROI
Short-form video is where many marketers now see their best return. In HubSpot's 2026 State of Marketing Report, short-form video was the top ROI-driving content format, cited by 49% of marketers, ahead of long-form video (29%) and live-streaming video (25%), as listed in Revid's short-form video statistics. In Wyzowl's 2026 survey, 82% of marketers said video marketing gives them a good ROI.
The catch is measurement: most viewing happens inside TikTok, Instagram and YouTube, not on your site. Use tagged links in bios and descriptions, platform-specific promo codes, the self-reported attribution field, and changes in branded search to connect videos to sales.
In dollars at the Growth rate ($39 for 2,000 credits), a 60-second video costs about $0.43 with stock footage, $0.68 with animated AI images, $1.46 with pro AI images, $4.29 with AI video clips and $13.30 with pro AI video. A 90-second video costs 1.5 times the 60-second price. Every price includes the AI voice-over (10 credits per 30 seconds); motion graphics show the calculator's upper bound.
Source: Revid public credit calculator (POST /api/public/v3/calculate-credits, no key), prompt-to-video workflow, 30, 60 and 90 seconds, queried Oct 29, 2026.
Show the data
| 60-second video, credits | 30-second video, credits | 60-second videos per Growth month | |
|---|---|---|---|
| Stock footage | 22 | 11 | 90 |
| Animated AI images | 35 | 18 | 57 |
| AI images, pro | 75 | 37 | 26 |
| AI video clips | 220 | 110 | 9 |
| Motion graphics | 275 | 160 | 7 |
| AI video, pro | 682 | 341 | 2 |
Track short-form video ROI with Revid
Revid turns an idea, a script or a link into a finished short-form video and publishes it to TikTok, Instagram and YouTube, which gives you both sides of the formula in one place:
- Create the video from a script or prompt, or from a product page with the AI product video generator.
- Check the estimated credit cost before generating: that is your production cost per video.
- Publish or schedule it through Revid's social media publishing, with your tagged link in the caption or bio.
- Read each post's views, likes and comments in Revid, then join them with the conversions from your tagged links in GA4.
Plans start at $39/month (Growth, 2,000 credits); the live Revid pricing page is the reference.
Repurpose a winner
Turn our best-performing blog post on reducing customer churn into a 45-second vertical explainer. Hook: "Most SaaS companies lose customers in the first 30 days, here is why." Use stock footage with on-screen captions and a calm, confident voiceover, ending with a link to the full guide.
ROI from scaling content production
Producing more content raises total return only if each extra piece keeps performing. Track ROI by publishing cohort (all pieces published in a given month) as volume rises. If cohort ROI holds while output grows, keep scaling; if it falls, you have passed the point where more volume pays.
Three things erode ROI at scale. Pieces start competing for the same searches, quality slips, and platforms push back on mass-produced output: YouTube does not let content made from generic templates that looks mass-produced earn money, while AI-assisted work that shows the creator's own vision remains eligible. The cheapest way to scale is to turn proven pieces into new formats, which our content repurposing workflow lays out step by step.
Decision rule: scale a format only after it shows positive ROI at your current volume.
How to improve content ROI
Every improvement moves one of two inputs: lower cost or higher return.
- Fix conversion before traffic. A page with traffic but no conversions needs a better offer and call to action, not more promotion.
- Double down on winners. Update, redistribute and repurpose the pieces already in your top ROI bracket.
- Stop producing losing formats. If a format has negative ROI across a full window, move its budget to one that works.
- Shift toward bottom-of-funnel topics (comparisons, pricing, use cases) when you need return quickly.
- Lower production cost with templates, repurposing and AI tools, while keeping a human review step.
Our guide to content optimization strategies covers the on-page side in detail.
How to report content ROI to leadership
Leadership trusts a number it can reproduce. Keep the report to one page:
- Investment for the period, fully loaded.
- Attributed return in gross profit, with the attribution model and window stated.
- ROI and its trend against previous periods.
- Top pieces and what they have in common (topic, format, channel).
- What you will change next period and the result you expect.
Use the same definitions every period, show last-click and multi-touch figures side by side when they differ, and lead with the business outcome (pipeline, orders, retained customers) rather than traffic. Clarifying how content ROI is calculated up front settles most budget debates before they start.
FAQ
What is a good content ROI?
Any positive ROI that beats what the same budget returns in your next-best channel, usually paid ads. There is no reliable universal benchmark, because costs, margins and attribution rules differ too much between companies to compare.
Are there established benchmarks for ROI from a content metadata strategy?
No reliable public benchmark exists for ROI from metadata work (tags, schema, taxonomy); vendor figures usually come from their own customers. Measure your own baseline before the change, such as search click-through rate, internal search success or time to find and reuse assets, and compare after.
How does Lionbridge measure content ROI?
Lionbridge does not publish a single method this article can verify, so ask your account team how they calculate it. Whoever measures it, a credible localization ROI report shows cost, conversions and revenue per locale against the source-language baseline.
How long does content take to show ROI?
It depends on the channel: paid and email content can show return within a campaign, while search content compounds over months. Set your measurement window to match your sales cycle and judge pieces only once they have completed it.
Do you need a content ROI service or agency?
Usually not to start: GA4, a CRM and a cost spreadsheet cover the basics. Outside help makes sense when your data sits in several systems, your sales cycle is long, or you need custom multi-touch attribution.
Sources
- Revid public credit calculator (POST /api/public/v3/calculate-credits, no key), prompt-to-video workflow, 30, 60 and 90 seconds, queried Oct 29, 2026.
- HubSpot, 2026 Marketing Statistics, Trends & Data (2026)
- Wyzowl, Video Marketing Statistics 2026 (December 2025)
Charts and figures checked on November 6, 2026.