Video Engagement Metrics: What to Track, Formulas and Benchmarks
Which video engagement metrics to track, how to calculate engagement rate, what good looks like on TikTok, Reels and Shorts, and how to diagnose a video from its numbers.

On this page
Video engagement metrics measure what viewers do after a video starts: how long they watch (average view duration, retention, completion rate) and how they react (likes, comments, shares, saves, link clicks). The standard formula is engagement rate = (likes + comments + shares) ÷ views × 100. Watch time and shares tell you the most, and raw views tell you the least.
Engagement is thinner than most creators assume. In Revid's analysis of 176,367 TikToks with 1,000+ likes posted between October 2025 and October 2026, viewers left 7.1 likes per 100 views, but only 0.88 shares and 0.08 comments. And since August 24, 2026, YouTube counts a view the moment a video starts to play, so a view count now says even less about whether anyone actually watched.
- TikTok likes per 100 views
- 7.1
- Revid, 176,367 TikToks
- TikTok shares per 100 views
- 0.88
- Revid, 176,367 TikToks
- Average TikTok engagement rate by followers
- 2.60%
- Socialinsider, August 2026
- Viewers who watch business videos under 1 minute to the end
- 65%
- Vidyard, 2024
What are video engagement metrics?
They fall into two groups:
- Attention metrics show whether people kept watching: play rate, average view duration, audience retention, completion rate and rewatches.
- Action metrics show whether people did something: likes, comments, shares, saves, follows and clicks on your call to action.
Views sit outside both groups. A view is an opportunity, not proof of interest. A video with 100,000 views that loses most viewers in the first 3 seconds did worse than a video with a tenth of the views that people watched to the end and sent to friends.
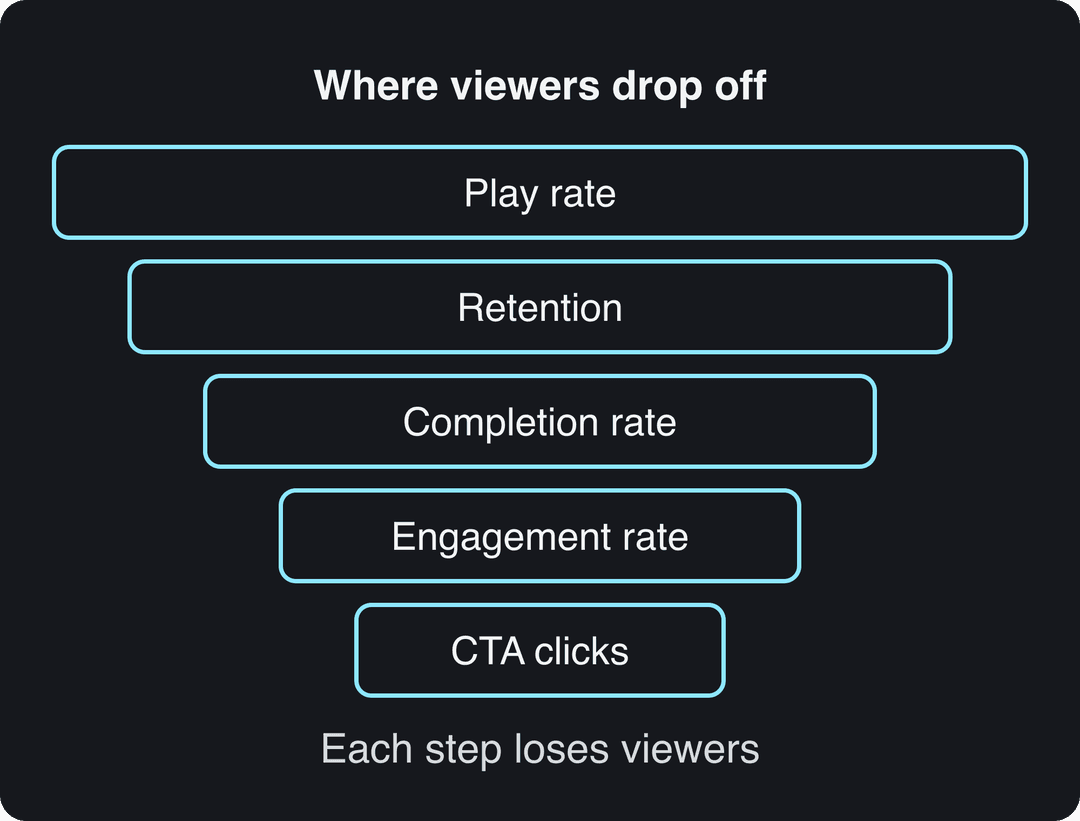
Every step of the path from impression to click loses viewers, and each step has its own metric. When a video underperforms, find the step where the drop is biggest and fix that step first.
The video engagement metrics to track
| Metric | Formula | What it tells you | Where to look first |
|---|---|---|---|
| Play rate (or impressions click-through rate) | Plays ÷ impressions × 100 | Whether your thumbnail, cover, title or first frame earns the start | YouTube Studio, website video players |
| Average view duration | Total watch time ÷ views | How long a typical viewer stays | All platforms |
| Average percentage viewed | Average view duration ÷ video length × 100 | Retention, adjusted for length | YouTube, TikTok, Instagram |
| Audience retention curve | Share of viewers still watching at each second | Where exactly people leave | YouTube, TikTok |
| Completion rate | Viewers who finished ÷ viewers who started × 100 | Whether the video delivers on its promise | TikTok, website players |
| Engagement rate | (Likes + comments + shares) ÷ views × 100 | Overall reaction per viewer | Calculate it yourself |
| Share rate | Shares ÷ views × 100 | Whether people want to send it to someone | All platforms |
| Saves | Total saves | Whether people want to come back to it | TikTok, Instagram |
| CTA click-through rate | Clicks on your link ÷ views × 100 | Whether the video drives the action you want | Link tracking, Google Analytics |
| Follower conversion | New followers from the video ÷ views × 100 | Whether the video builds an audience | TikTok, Instagram, YouTube |
No single metric tells the whole story. A high play rate with low retention means the packaging promised something the video did not deliver. High completion with few shares means the video is useful but not worth passing on.
Play rate and click-through rate
Play rate is the share of people who started your video after it appeared on their screen. It measures your packaging: the thumbnail or cover, the title and the opening frame. If play rate is low while retention is normal, the video itself is fine and the packaging needs work.
On YouTube long-form videos you can test this directly: Test and Compare in YouTube Studio on desktop runs up to 3 titles and thumbnails and shows the winner (the one with the most watch time) to everyone. Shorts are not eligible.
Average view duration and audience retention
Average view duration is the metric to watch if you only watch one. It reflects whether the video held attention, it adds up to total watch time, and it is the base of YouTube's engaged views and watch hours used for monetization.
Read the retention curve, not just the average. A steep drop in the first seconds is a hook problem. A sudden cliff at the same timestamp across several videos points to a segment viewers do not want (a long intro, a sponsor read, a slow explanation).
Completion rate
Completion rate is the share of viewers who reached the end. It falls naturally as videos get longer, so only compare it between videos of similar length. Vidyard's 2024 benchmark data shows the size of the effect: for business videos under 1 minute, 65% of viewers stay engaged to the end, compared with 20% for videos over 20 minutes.
How do you calculate video engagement rate?
Add likes, comments and shares, divide by views and multiply by 100. Some teams add saves; if you do, add them every time so your numbers stay comparable.
There are two versions, and they answer different questions:
- By views (interactions ÷ views): use it to compare individual videos. It tells you how viewers reacted.
- By followers (interactions ÷ follower count): use it to compare accounts. Most industry benchmarks use this version.
Instagram tools and agencies often use their own variant; this breakdown of the Instagram engagement rate formula shows the common versions. For how engagement rate fits with reach and other social metrics, see our guide to social media engagement formulas.
Applied to Revid's TikTok data, a typical well-performing video had roughly 8 interactions per 100 views, almost all of them likes.
Shares, comments and saves
Likes cost the viewer nothing, so they are the weakest action signal. Shares put your video in front of people who do not follow you, comments show a video started a conversation, and saves show it was worth coming back to.
Because shares are rare (0.88 per 100 views in Revid's TikTok sample), track share rate separately instead of letting likes hide it inside one engagement number.
What is a good video engagement rate?
A good engagement rate depends on the platform and on which formula you use, so compare against a benchmark measured the same way.
| Benchmark | Figure | Source |
|---|---|---|
| TikTok engagement rate by followers | 2.60% | Socialinsider, 2026 study of 69 million short-form videos |
| Instagram Reels engagement rate by followers | 0.45% | Socialinsider, 2026 |
| YouTube Shorts engagement rate by followers | 0.30% | Socialinsider, 2026 |
| TikTok likes per 100 views | 7.1 | Revid, 176,367 TikToks with 1,000+ likes |
| TikTok shares per 100 views | 0.88 | Revid, same sample |
| TikTok comments per 100 views | 0.08 | Revid, same sample |
| Business videos under 1 minute watched to the end | 65% | Vidyard, 2024 |
The Socialinsider figures are collected with other sourced numbers in our YouTube Shorts statistics. Revid's per-view rates come from videos that already passed 1,000 likes, so they describe videos that did reasonably well, not the average upload. The full method is in our study of what makes a TikTok go viral.
The benchmark that matters most is your own. Take the median of your last 10 videos on each platform and treat anything clearly above it as a winner worth repeating. For market-wide context on how businesses use video, SundaySky keeps a roundup of video marketing statistics.
Prompt to try
Make a 12-second vertical TikTok about one surprising kitchen hack: peeling garlic in 10 seconds by shaking cloves between two bowls. Open with the result on screen and the line "Stop peeling garlic by hand." Use fast cuts, bold captions and an upbeat track, and end on the reveal so viewers want to send it to a friend.
How video length changes engagement
Longer videos lose a larger share of viewers but can earn more total watch time, so the right length depends on which metric you need. For how-to content, Wistia's video marketing statistics report that viewers watch an average of 82% of videos under one minute, over 50% of videos between one and 30 minutes, and about 26% of videos between 30 and 60 minutes.
On TikTok, length barely changes views for recent posts. In Revid's 12-month study, every length bucket from under 15 seconds to 10 minutes had a median between 58K and 76K views, with 61 to 90 seconds slightly ahead at 70K. Videos under 15 seconds had the lowest median (58K) but the most shares per view: 1.41 per 100. Revid's full index of about 2.39 million TikToks across all dates, published on our short-form video statistics page, found 16 to 30 second videos ahead (about 141K median), an edge that has faded for recent posts.
Length alone barely moves views: every bucket lands between 58K and 76K median views (the 790 videos over 10 minutes are a small, unusual group). Clips under 15 seconds get shared the most per view.
Source: Revid analysis of 176,367 TikToks with 1,000+ likes posted between Oct 1, 2025 and Oct 16, 2026 (61,203 creators)
Show the data
| Median views | Share that passed 1M views | Shares per 100 views | |
|---|---|---|---|
| Under 15 s | 57.6K | 11.6% | 1 |
| 16 to 30 s | 64.9K | 12.3% | 1 |
| 31 to 60 s | 61.8K | 11.8% | 1 |
| 61 to 90 s | 70.5K | 12.2% | 1 |
| 91 s to 3 min | 63.4K | 11.1% | 1 |
| 3 to 10 min | 76.4K | 12.4% | 1 |
| 10 min+ | 129.6K | 13.8% | 0 |
The decision rule: if you want shares and completion, keep it short. If you want watch time or TikTok Creator Rewards (which only pays on videos at least one minute long), go longer and protect retention with a tight structure. More detail is in our guide to social media video length.
How each platform counts views and engagement
A view does not mean the same thing everywhere, so never compare raw view counts across platforms.
| Platform | What counts as a view | Where to find engagement data |
|---|---|---|
| YouTube (all formats) | Since August 24, 2026, the moment a video starts to play. Monetization still uses engaged views and engaged watch hours. | YouTube Studio > Analytics |
| YouTube Shorts | Since March 31, 2025, every start or replay, with no minimum watch time | YouTube Studio > Analytics |
| Views count times content was played or displayed; Viewers counts unique accounts | Insights on each reel; follower activity needs 100+ followers and covers up to 90 days | |
| TikTok | Counted by TikTok on play | TikTok Studio > Analytics, with 7, 28, 60 or 365-day ranges or custom |
| Your website | Defined by your video player | Your player's stats, or Google Analytics with video events |
Because YouTube and Shorts views now count instantly, judge them by average view duration and percentage viewed, not by the view total. On Instagram, use Viewers rather than Views when you want to know how many people you reached. Instagram trial reels, shown first to non-followers, report insights within 24 hours, which makes them a fast way to test a hook.
To compare platforms fairly, log the same five columns for every video: views, average view duration, average percentage viewed, engagement rate by views and share rate. Calculate the last two yourself so the formula is identical everywhere.
How to diagnose a video from its metrics
Read the metrics together. Each pattern points to one fix.
| If you see | It usually means | Do this |
|---|---|---|
| Low play rate, normal retention | The packaging does not earn the click | Change the cover, thumbnail, title or first frame; test titles and thumbnails on YouTube long-form |
| Big drop in the first 3 seconds | The opening does not match what the viewer expected | Rewrite the first line and show the payoff or result first |
| A cliff at the same timestamp in several videos | A recurring segment viewers skip | Cut or shorten that segment (intros, recaps, long setups) |
| Good retention, few shares | Useful but not worth sending | Add one result, line or reveal people would forward to a friend |
| Many comments, low retention | The opener provokes but the video does not deliver | Keep the angle, tighten the pacing after the hook |
| High completion, low CTA clicks | The call to action is late or vague | Place one specific CTA at the payoff moment, on screen and spoken |
| Strong on one platform, weak on another | Different audience expectations | Adapt the hook and length per platform instead of reposting as is |
Prompt to try
Create a 45-second vertical video explaining 3 budgeting mistakes people make in their first job. Hook in the first 3 seconds with "You're losing $200 a month and don't know it," then show one mistake every 10 seconds with on-screen text and new B-roll. Ask mid-video "Which one are you guilty of?" and close on one specific tip.
How to improve your video engagement metrics
- Win the first 3 to 5 seconds. State the promise or show the result before anything else. Our list of TikTok hooks that stop the scroll gives opening lines you can adapt.
- Front-load the value. Skip logo animations and greetings. Answer the question the title asked as early as you can.
- Change something on screen every few seconds. On-screen text overlays, B-roll, a zoom or a sound effect resets attention and flattens the retention curve.
- Ask one specific question. "Which of these would you pick?" gets more comments than "Let me know what you think." Ask it mid-video, not only at the end.
- Make it load fast. A video that stalls loses viewers before it starts; this guide shows how to compress videos for social media without visible quality loss.
- Test one change at a time. Change the hook or the length or the cover, not all three, so you know what moved the number.
The index leans toward videos that surface in hashtag and keyword searches, so its view counts run high: compare the groups, not the absolute numbers.
Source: Revid TikTok index: 2,377,477 TikToks with AI labels per video, snapshot of Sep 15, 2026. Median views estimated from view buckets.
Show the data
| Median views | Share past 1M views | |
|---|---|---|
| Angry | 232.4K | 29.8% |
| Sad | 178.1K | 28.6% |
| Humorous | 173.9K | 28.3% |
| Excited | 129.1K | 24.8% |
| Neutral | 116K | 23.3% |
| Happy | 114.2K | 23.8% |
| Informative | 104.4K | 20.6% |
| Inspirational | 88.4K | 20.8% |
Build a weekly engagement review
A short routine turns the numbers into decisions:
- Export the last 7 days from each platform and add every video to your five-column sheet.
- Compare each video with your own median and mark the clear winners and losers.
- Group videos by topic and format to spot trends, such as one topic that keeps getting shares.
- Compare viewers who followed you this month with last month's to see whether a new format brings people who stay.
- Pick one change for next week, based on the diagnosis table above.
Our guide on how to measure content performance covers the wider reporting setup.
Track results and make the next video with Revid
If you publish with Revid, the results and the next video live in the same place:
- Publish or schedule to TikTok, Instagram and YouTube from one queue with Revid's social media publishing.
- Every post published through Revid reports its views, likes and comments, so you can spot what worked.
- Remix any post that did well in one click, or start from Revid's library of about 2.77 million videos with public engagement data to repurpose formats that already went viral.
- Run a free Deep analysis (up to 60 a day) on any video to see its hook, timed structure and scroll-stopping moment.
For retention curves and watch time, keep using each platform's native analytics.
FAQ
Which video engagement metric matters most?
Average view duration, read alongside the retention curve. It shows whether people actually watched, and YouTube's monetization is built on engaged watch time rather than raw views.
Do shares or likes matter more?
Shares matter more. A like costs the viewer nothing, while a share puts your video in front of new people, and shares are about 8 times rarer than likes in Revid's TikTok data.
Is completion rate the same as audience retention?
No. Completion rate is one number (the share of viewers who reached the end), while audience retention shows the share still watching at every second, which tells you where they left.
Should I calculate engagement rate by views or by followers?
Use views to compare your own videos and followers to compare accounts. Most published benchmarks, including Socialinsider's, use the follower version, so match the formula before comparing.
Why did my YouTube views go up but watch time did not?
Since August 24, 2026, YouTube counts a view as soon as playback starts, so views can rise without real watching. Judge videos by average view duration and percentage viewed instead.
Sources
- Revid analysis of 176,367 TikToks with 1,000+ likes posted between Oct 1, 2025 and Oct 16, 2026 (61,203 creators)
- Revid TikTok index: 2,377,477 TikToks with AI labels per video, snapshot of Sep 15, 2026. Median views estimated from view buckets.
- Socialinsider, TikTok vs. Reels vs. Shorts: 2026 Engagement Data (August 2026)
- Vidyard, Video in Business Benchmark Report (2024)
Charts and figures checked on November 6, 2026.