
What Is Social Media Engagement? Metrics, Formulas and Benchmarks
Social media engagement is every action people take on your content beyond seeing it. Here is what counts, how to calculate your engagement rate, and what good looks like in 2026.

On this page
Social media engagement is any action people take on your content beyond seeing it: likes, comments, shares, saves, link clicks, replies and follows. It is usually reported as an engagement rate, calculated as total engagements divided by reach (or followers), multiplied by 100.
The actions are not equal. In Revid's analysis of 176,367 TikToks with 1,000+ likes posted between October 2025 and October 2026, those videos collected likes equal to 7.1% of views, shares equal to 0.88% and comments equal to just 0.08%. Comments and shares are rare, which is exactly why they tell you more about a post than a pile of likes.
- Average TikTok engagement rate by followers, vs 0.45% on Reels and 0.30% on Shorts
- 2.60%
- Socialinsider, August 2026
- Likes as a share of views on TikToks with 1,000+ likes
- 7.1%
- Revid TikTok index
- Shares as a share of views on the same TikToks (comments: 0.08%)
- 0.88%
- Revid TikTok index
- Shares per 100 views for TikToks under 15 seconds, the highest of any length
- 1.4
- Revid TikTok index
What counts as social media engagement?
Engagement means a viewer did something with your post instead of scrolling past it. Every platform counts a slightly different set of actions, but they fall into the same groups, from low effort to high commitment.
| Engagement type | Examples | What it tells you |
|---|---|---|
| Approval | Likes, reactions, hearts | The post was pleasant enough to tap. Weakest signal. |
| Conversation | Comments, replies, DMs about the post | It made someone think and type. |
| Saves | Instagram saves, TikTok favorites, bookmarks | It was useful enough to keep. |
| Amplification | Shares, reposts, sends to a friend | Someone put their own name behind it. Strongest organic signal. |
| Action | Link clicks, profile visits, follows | It moved someone toward you or your business. |
| Attention (video) | Watch time, retention, rewatches | People stayed, not just stopped. |
So when someone asks "what are social media engagements?", the short answer is: every countable interaction in that table. When a tool reports one engagement number, check which of these actions it adds up, because tools disagree.
Reach vs engagement: what is the difference?
Reach is how many unique accounts saw your post. Impressions (or views) count every time it was shown or played, including repeats. Engagement is what those people did after seeing it.
You need both. High reach with low engagement usually means a strong hook or a lucky placement but content that did not deliver. High engagement with low reach means your existing audience loves it and the platform has not tested it widely yet: that is a post worth reworking and posting again.
One 2026 change matters here: since August 24, 2026, YouTube counts a view the moment a video starts to play, across Shorts, long-form and live. More views per post means lower per-view engagement rates than older YouTube data, so do not compare your current per-view rate with numbers from before that date.
Which social media engagement metrics matter most?
Track all of them, but weight them by effort.
- Likes: easy to get and easy to fake. Useful for spotting trends across many posts, weak for judging one post.
- Comments: a direct read on what people think. Read them, not just count them: the questions people ask are your next five posts.
- Shares: the metric that grows reach beyond your followers. If you only optimize one number, make it shares.
- Saves: the best sign of useful content (tutorials, checklists, templates). A post with modest likes and many saves is a format to repeat.
- Click-through rate (CTR): clicks divided by impressions. It measures whether your caption and call to action earned the next step.
- Watch time and audience retention: for video, how long people stayed matters more than whether they started. Our guide to video engagement metrics covers retention curves in detail.
If you manage several accounts, a dashboard saves hours. This roundup of social media analytics tools from RedactAI compares the main options.
How do you calculate social media engagement?
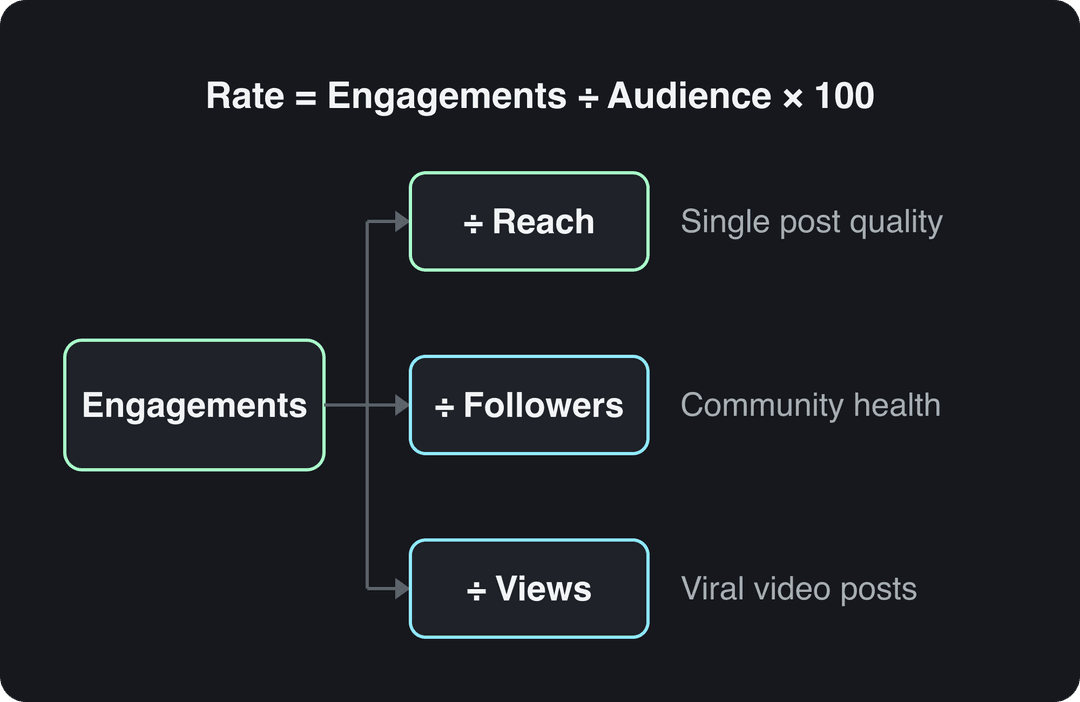
Add up the engagements on a post, divide by the audience you are measuring against, and multiply by 100. The audience you choose changes the answer, so pick the formula that matches your question.
| Formula | Calculation | Use it to judge |
|---|---|---|
| Engagement rate by reach (ERR) | Engagements ÷ reach × 100 | The quality of a single post |
| Engagement rate by followers (ERF) | Engagements ÷ followers × 100 | The health of your community over time |
| Engagement rate by views or impressions | Engagements ÷ views × 100 | Video and viral posts, where views far exceed followers |
Worked examples:
- A post reaches 5,000 people and gets 250 engagements. ERR = 250 ÷ 5,000 × 100 = 5%.
- An account has 10,000 followers and a post gets 400 engagements. ERF = 400 ÷ 10,000 × 100 = 4%.
ERR is the fairer score for one post, because not every follower sees every post. ERF is better for tracking whether your audience is cooling off. Use the same formula every time, or your trend line means nothing. For averaging across posts and per-platform quirks, see our full guide to what an engagement rate is.
https://www.youtube.com/embed/ETZ7z53X8_I
What is a good engagement rate? Social media engagement stats for 2026
There is no single good number, because each platform distributes content differently. Socialinsider's 2026 study of 69 million short-form videos found an average engagement rate by followers of 2.60% on TikTok, 0.45% on Instagram Reels and 0.30% on YouTube Shorts, with an average of 50 comments per video on TikTok, 20 on Reels and 10 on Shorts (more sourced figures on our YouTube Shorts statistics page).
Per view, the TikToks in Revid's index give a reference point for strong posts: likes at 7.1% of views, shares at 0.88% and comments at 0.08%. Remember the limit: the index only holds videos that already passed 1,000 likes, so these are the rates of posts that did well, not of an average post. Our broader short-form video statistics page has the full dataset.
Why the gaps between platforms are so large:
- Discovery vs follower feeds. TikTok opens on the personalized For You feed, so small accounts can reach far beyond their followers. That inflates engagement measured by followers.
- Why people open the app. People come to Instagram for visuals and friends, to LinkedIn for work and industry news, and to Facebook for groups and people they know. Intent shapes how readily they comment or share.
- Format. Short video invites instant reactions. A long post or link may get fewer likes but more meaningful clicks.
Agency roundups such as Digital Silk's social media statistics publish many benchmark figures; treat any number without a named study and method as a rough guide only. DataReportal's research on time spent on social media shows how much attention is on these platforms, which is also why competition for each interaction is so stiff.
The benchmark that matters most is your own. Decision rule: calculate your average rate per platform over your last month of posts, then judge each new post against that baseline. Beat it consistently and you are growing, whatever the industry average says.
How to measure engagement on social media
Every major app has native analytics. Start there before paying for a tool.
- TikTok: open your profile, then the menu, TikTok Studio, Analytics, View all. You can view 7, 28, 60 or 365 days or a custom range. The Viewers tab shows when your viewers were most active over the last 7 days.
- Instagram: use Insights on a professional account. Instagram now leads with Views (times your content was played or displayed) and reports Viewers (unique accounts) separately, with interactions such as likes, comments, saves and shares per post. Follower insights need at least 100 followers and cover up to the past 90 days.
- YouTube: YouTube Studio analytics show likes, comments, shares and subscribers gained per video, plus retention for each video.
- Facebook and LinkedIn: each post shows reactions, comments and reposts or shares, with reach or impressions in the post analytics.
Export the numbers into one spreadsheet each month, with one row per post and a column for each engagement type. That is enough to see which formats earn saves and shares. Our guide on how to measure content performance gives a full tracking template.
What does media engagement mean on Instagram?
On Instagram, "media engagement" means the interactions on one specific post, reel or story (a piece of media), as opposed to account-level activity such as profile visits or follower growth. In practice, it is the likes, comments, saves and shares a single piece of content collected.
To judge a reel, divide its interactions by its views or accounts reached, not by your follower count. Reels are shown to many non-followers, so a follower-based rate can look inflated or deflated depending on how far the reel travelled.
How to increase social media engagement
Ask a question people can answer in five seconds
Open-ended prompts like "thoughts?" get silence. Specific, low-effort prompts get replies. Try these caption endings, or generate variations with a free Instagram caption generator:
- "Option A or option B? One letter in the comments."
- "What would you add to this list?"
- "My go-to coffee order is ______. Yours?"
- "Wrong answers only: what is this tool for?"
Then reply to the early comments. A reply often turns one comment into a thread, and threads are where community forms.
Prompt to try
Make a 45-second vertical checklist video titled "5 mistakes that kill your Instagram engagement". Open with the hook "You're probably doing number 3 right now", then show each mistake as a numbered on-screen step with a clear fix. Clean motion graphics style, calm confident voiceover, and end with "Save this for your next post".
A caption of 41 to 80 characters (one clear sentence) performed best. Posts with no caption at all earned roughly half the median views.
Source: Revid analysis of 176,367 TikToks with 1,000+ likes posted between Oct 1, 2025 and Oct 16, 2026 (61,203 creators)
Show the data
| Median views | Share that passed 1M views | |
|---|---|---|
| No caption | 36.4K | 7.5% |
| 1 to 40 | 58K | 11.1% |
| 41 to 80 | 67.3K | 12.5% |
| 81 to 150 | 66.6K | 12.3% |
| 151 to 300 | 63.8K | 11% |
| 300+ | 67.8K | 11.7% |
Make posts worth saving
Saves come from utility. Formats that earn them: step-by-step tutorials, checklists, templates, before-and-after comparisons and "mistakes to avoid" lists. If a post would still be useful in three months, it is save-worthy.
Prompt to try
Create a 12-second vertical video with one punchline about remote work: "Me explaining to my boss that the Wi-Fi only fails during meetings". Start on the punchline in the first second, use quick funny AI visuals and bold captions, and end on a frame people will want to send to a coworker.
Build for the share
People share what makes them look smart, funny or caring to their friends. Before posting, ask: who would someone send this to, and what would they type with it? If you cannot answer, rework the angle.
Short videos are built for sharing. In Revid's analysis of TikToks from October 2025 to October 2026, videos under 15 seconds had the lowest median views of any length (58K) but the most shares per view: 1.41 shares per 100 views. Median views were close across every length from under 15 seconds to 10 minutes, so choose length by the job: very short for shareable punchlines, longer for tutorials that earn saves. The full method is in our study of what makes a TikTok go viral.
Length alone barely moves views: every bucket lands between 58K and 76K median views (the 790 videos over 10 minutes are a small, unusual group). Clips under 15 seconds get shared the most per view.
Source: Revid analysis of 176,367 TikToks with 1,000+ likes posted between Oct 1, 2025 and Oct 16, 2026 (61,203 creators)
Show the data
| Median views | Share that passed 1M views | Shares per 100 views | |
|---|---|---|---|
| Under 15 s | 57.6K | 11.6% | 1 |
| 16 to 30 s | 64.9K | 12.3% | 1 |
| 31 to 60 s | 61.8K | 11.8% | 1 |
| 61 to 90 s | 70.5K | 12.2% | 1 |
| 91 s to 3 min | 63.4K | 11.1% | 1 |
| 3 to 10 min | 76.4K | 12.4% | 1 |
| 10 min+ | 129.6K | 13.8% | 0 |
Do not buy followers
Bought followers are bots or inactive accounts that never like, comment, share or save. They inflate your follower count and drag down every follower-based engagement rate, which makes your account look weak to brands reading your media kit. Build the audience you actually want to reach.
Make engagement-ready videos with Revid
If video is your main format, starting from formats that already earned engagement is faster than guessing. Revid includes a searchable library of about 2.77 million real short-form videos with their public views, likes, comments and shares.
- Search the library by topic, platform and engagement tier to find viral videos to remix.
- Run a free Deep analysis (up to 60 a day) to see the hook, the timed structure and the scroll-stopping moment.
- Choose "Make it about your topic" and Revid's AI video generator writes an original script with visuals, voice-over and captions.
- Publish or schedule to TikTok, Instagram and YouTube from one queue. Each post reports its views, likes and comments, and you can remix any post that did well in one click.
FAQ
What is ER in social media?
ER stands for engagement rate: total engagements divided by reach, followers or views, multiplied by 100. Always note which denominator was used, because the same post can show different ER values under each formula.
Are views a form of engagement?
Usually no. Views and impressions measure exposure, while engagement counts actions taken after seeing the post. Watch time and retention sit in between: they are often grouped with engagement for video because they show active attention.
Does buying followers hurt engagement?
Yes. Fake followers never interact, so your engagement rate by followers drops, and the account looks less credible to brands and partners reviewing your numbers.
How often should I post to keep engagement up?
Post at the highest frequency you can sustain without the quality dropping. If engagement per post falls after you increase frequency, scale back until your baseline recovers.
Sources
- Revid analysis of 176,367 TikToks with 1,000+ likes posted between Oct 1, 2025 and Oct 16, 2026 (61,203 creators)
- Socialinsider, TikTok vs. Reels vs. Shorts: 2026 Engagement Data (August 2026)
Charts and figures checked on November 6, 2026.