
Social Media Report Template (2026): Free Layout + 8 Tools
A free social media report template with the seven sections every monthly report needs, KPI and platform tables, a Google Sheets version and 8 tools that automate it.

On this page
A social media report template is a fixed layout you fill in every month: a short summary, KPIs against goals, one row per platform, top and bottom posts, audience changes, insights and next steps. Keep the sections and metric definitions identical month to month so the numbers compare, and put the metric tied to the business goal first.
The catch in 2026 is that the metrics themselves moved. Instagram insights now lead with Views instead of impressions, and since August 24, 2026 YouTube counts a view the moment a video starts to play, on Shorts, long-form and live. Put a September YouTube total next to a July one without a note and your report can show growth that never happened. The template below is built on the current definitions.
- Average TikTok engagement rate by followers in 2026
- 2.60%
- Socialinsider, August 2026
- Average Instagram Reels engagement rate by followers in 2026
- 0.45%
- Socialinsider, August 2026
- Average YouTube Shorts engagement rate by followers in 2026
- 0.30%
- Socialinsider, August 2026
- Likes as a share of views on TikToks that cleared 1,000 likes
- 7.1%
- Revid analysis of viral TikToks
What should a social media report include?
Seven sections cover what a client, a manager or your future self needs. Each one answers a question the reader will ask anyway.
| Section | What goes in it | Question it answers |
|---|---|---|
| 1. Summary | 3 to 5 sentences: the headline result, the main reason, the decision you need | Did it work? |
| 2. KPIs vs goals | The 3 to 5 numbers tied to goals: target, actual, change vs last month | Are we on track? |
| 3. Platform breakdown | One row per platform: posts, views, reach, engagement rate, follower change, link clicks | Where is it working? |
| 4. Top and bottom content | The 3 best and 3 worst posts, each with a one-line reason | What should we make more of? |
| 5. Audience | Follower growth, shifts in age, location or active hours | Who are we reaching? |
| 6. Insights | What the numbers mean, written as cause and effect | Why did it happen? |
| 7. Next steps | Actions with an owner and a date | What changes next month? |
A social media management report adds the operational side: posts published versus planned, average response time to comments and messages, and open issues (a complaint thread, a paused campaign). Use it when the reader pays for the work as much as for the results, which is the case for most agency retainers.
Free social media report template you can copy
Copy these tables into a doc, a slide deck or a sheet. Replace the brackets and delete the rows you do not track.
Monthly social media report: [Brand], [Month Year]
Summary: [Headline result in one sentence]. [Main reason]. [Decision or approval needed].
| KPI | Goal | This month | Last month | Change | Comment |
|---|---|---|---|---|---|
| Views (all platforms) | |||||
| Engagement rate (by views) | |||||
| Net follower growth | |||||
| Link clicks or website sessions from social | |||||
| Leads or sales from social |
| Platform | Posts | Views | Reach (unique viewers) | Engagement rate | Followers +/- | Link clicks |
|---|---|---|---|---|---|---|
| TikTok | ||||||
| YouTube | ||||||
| Post (link) | Best or worst | Format | Views | Engagement rate | Why it worked or failed |
|---|---|---|---|---|---|
| Best | |||||
| Worst |
For a simple social media reporting template (a solo creator or a small business), keep only four blocks: the summary, the KPI table, your 3 best posts and one change for next month. It fits on one screen and takes minutes to fill in.
Social media report template for Google Sheets or Excel
A spreadsheet version stays free and fully customizable. Build it with three tabs:
- Data: one row per post, with columns A Date, B Platform, C Format, D Link, E Views, F Reach, G Likes, H Comments, I Shares, J Saves, K Link clicks, L Follows.
- Goals: one row per KPI with the monthly target.
- Summary: the KPI and platform tables above, filled by formulas.
These formulas work the same in Google Sheets and Excel:
- Engagement rate per post (column M of the Data tab):
=(G2+H2+I2+J2)/E2, formatted as a percentage. - Views per platform for the month, with the platform name in A2, the start date in B1 and the end date in C1 of the Summary tab:
=SUMIFS(Data!E:E,Data!B:B,$A2,Data!A:A,">="&$B$1,Data!A:A,"<="&$C$1) - Change vs last month:
=(this_month-last_month)/last_month.
Paste each month's exports into the Data tab and the summary updates itself. If you want charts and a shareable link, connect the sheet to Looker Studio as a data source (covered in the tools section below).
Which social media metrics belong in the report?
Pick metrics from the goal, not from whatever the platform shows first. This social media KPIs template maps each goal to one primary KPI.
| Goal | Primary KPI | Supporting metrics | Where the data lives |
|---|---|---|---|
| Awareness | Views and reach | Follower growth, share of views from non-followers | Native platform analytics |
| Engagement | Engagement rate | Shares, saves, comments | Native platform analytics |
| Traffic | Link clicks | Sessions from social | Platform analytics, Google Analytics with UTM links |
| Leads and sales | Conversions from social | Cost per lead, revenue | Google Analytics, your CRM, your ads manager |
| Customer care | Average response time | Messages handled, tone of replies | Your social inbox tool |
How to calculate engagement rate (and what counts as good)
Write the formula in the report so nobody argues about it later: engagement rate = (likes + comments + shares + saves) ÷ views × 100. Some teams divide by followers instead. Either works if you pick one and keep it.
Benchmarks depend on that denominator. Socialinsider's 2026 study of 69 million short-form videos found an average engagement rate by followers of 2.60% on TikTok, 0.45% on Instagram Reels and 0.30% on YouTube Shorts (more sourced figures in our YouTube Shorts statistics).
For a per-view benchmark on TikTok: in Revid's analysis of 176,367 TikToks with 1,000+ likes posted between October 2025 and October 2026, likes equaled 7.1% of views, shares 0.88% and comments 0.08% (method and charts in Revid's study of viral TikToks). That sample only holds videos that already cleared 1,000 likes, so read it as the level of a post that worked, not as an account average.
Platform report templates: Instagram, Facebook, TikTok, YouTube, LinkedIn
| Platform | Where to export | Report these | 2026 note for your template |
|---|---|---|---|
| Insights on a professional account | Views, viewers (reach), interactions, shares, saves, follows | Views replaced impressions as the headline metric; follower insights need 100 followers and cover up to the past 90 days | |
| Meta Business Suite or the Professional Dashboard | Views, reach, reel plays, link clicks, follows | Since June 2025 every new video is a reel, so video and reel metrics are one line | |
| TikTok | TikTok Studio > Analytics (app or Studio Web) | Views, likes, comments, shares, follower change, traffic source | Date ranges are 7, 28, 60 or 365 days or custom: use custom for calendar months |
| YouTube | YouTube Studio > Analytics | Views, watch time, subscribers, click-through rate, revenue | Views count at play start since August 24, 2026; YPP earnings still use engaged views |
| Page analytics in the admin view | Impressions, reactions, comments, reposts, clicks, follower growth | Report company Page and personal-profile posts in separate tables |
What should an Instagram monthly report include?
For an Instagram report template, split results by format, because reels, carousels and stories behave differently:
- Reels: views, viewers, share of views from non-followers, average watch time, shares, saves.
- Carousels and photos: views, saves, shares, profile visits.
- Stories: views, replies, link sticker taps, exits.
- Account: net follows, profile visits, external link taps, top cities and most active times (these need 100 followers).
Tag trial reels separately. Instagram shows them to non-followers first and they don't affect the ranking of your standard reels, so mixing them into the average blurs both numbers.
Instagram ads report template
Pull these columns from Meta Ads Manager, one row per campaign or ad set:
| Campaign | Spend | Reach | Impressions | CPM | Link clicks | CTR | CPC | Results | Cost per result | ROAS |
|---|---|---|---|---|---|---|---|---|---|---|
Keep paid and organic in separate tables. Blended numbers hide which one did the work.
Facebook analytics report template
Use the same platform table, then add reel plays, average watch time, link clicks per post and follower growth. If you are in Facebook Content Monetization (it is invite-only), add a row for earnings. Since March 2026 Facebook deprioritizes reaction-only reels, clip-stitching and lightly edited reposts, so flag it in the bottom-content section when a weak post fell into one of those formats.
LinkedIn report template
LinkedIn readers care about who saw a post as much as how many people did. Report impressions, engagement rate, clicks and follower growth, then add follower demographics (job function, seniority, industry) from Page analytics. Keep company Page posts and founder or employee posts in separate tables.
The day matters far less than the hour: every weekday lands within a few percent of the others, and Saturday and Sunday posts pass 1M views slightly more often.
Source: Revid analysis of 123,704 English-language TikToks with 1,000+ likes posted between Oct 1, 2025 and Oct 16, 2026
Show the data
| Median views | Share that passed 1M views | |
|---|---|---|
| Monday | 63.5K | 12.5% |
| Tuesday | 63.5K | 12.4% |
| Wednesday | 62.7K | 12.5% |
| Thursday | 64.6K | 12.5% |
| Friday | 64.5K | 12.6% |
| Saturday | 70.2K | 13.4% |
| Sunday | 65.1K | 13.6% |
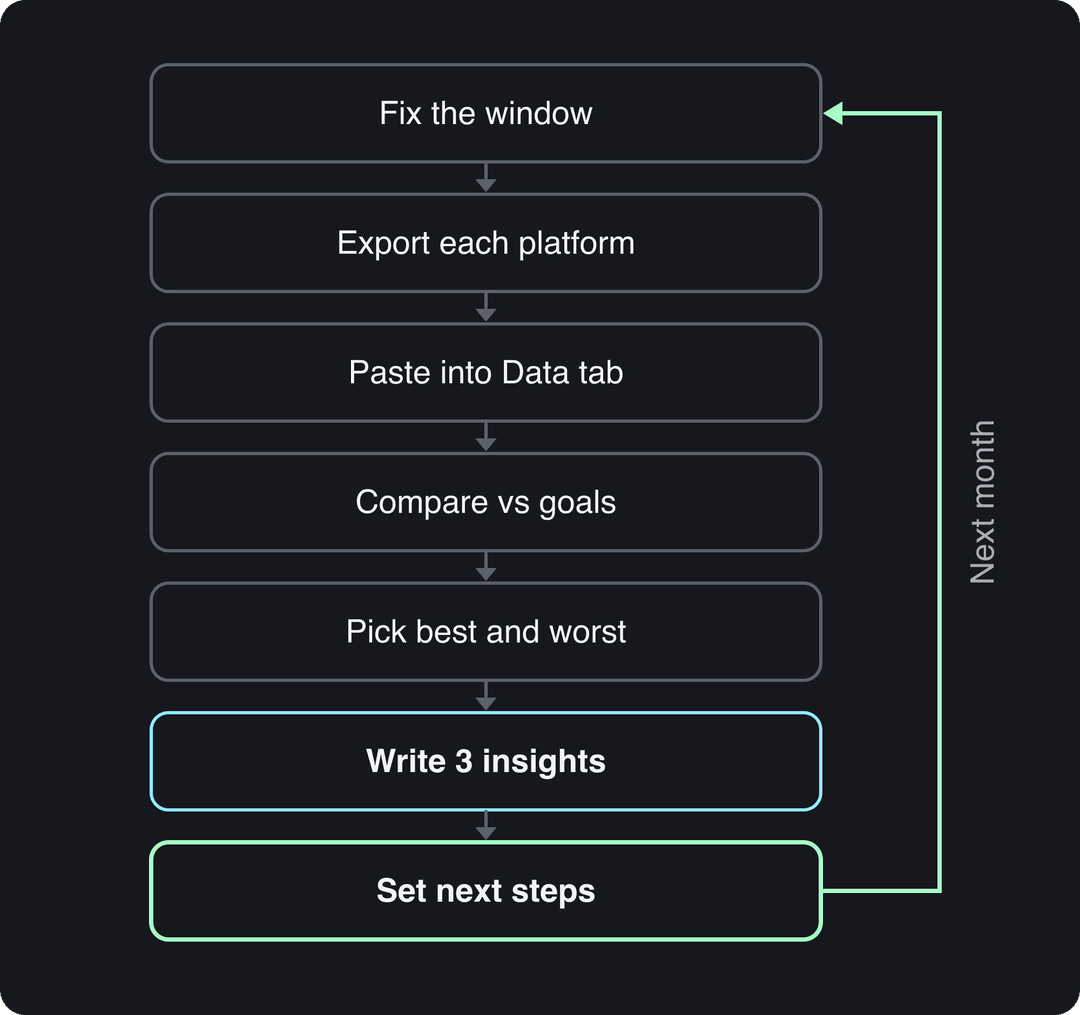
How to create a monthly social media report
- Fix the window. Use the calendar month and pull data in the first days of the next month. Instagram follower insights only go back up to 90 days, so a late report can lose data.
- Export each platform. Use the custom date range in TikTok Studio, YouTube Studio and Instagram Insights so every platform covers the same dates.
- Paste into the Data tab. One row per post, same columns every month.
- Compare against goals and last month. Fill the KPI table; anything that moved more than its usual monthly swing gets a comment.
- Pick the 3 best and 3 worst posts. Write one reason for each: the hook, the format, the topic or the posting time.
- Write 3 insights. Use the form: we saw X, because Y, so next month we will Z.
- Set next steps. Turn each insight into an action with an owner and a date, and feed it into your content planning template and social media calendar.
How to present a social media report to clients
Clients read the first page and skim the rest. A monthly client reporting workflow with a templated layout makes that first page do the work:
- Lead with the business result, not likes: leads, sales, sign-ups or traffic, then the social metrics that explain them.
- Use the same layout every month so the client learns where to look. Change the numbers, never the order.
- Explain every dip before they ask, in one sentence: what happened, why, what you are doing about it.
- Show the posts with thumbnails and links, not just their numbers.
- End with the decision you need: approve a budget shift, a new format, a posting frequency.
- Walk through it on a short call after sending. A conversation turns the report into decisions.
Prompt to try
Make a 30-second vertical how-to video for a small bakery's Instagram on how to keep bread fresh for 5 days. Open with the answer in the first line: "Stop putting bread in the fridge." Show three quick tips with close-up kitchen visuals, bold captions and a friendly voiceover, and end with a prompt to save the video.
The index leans toward videos that surface in hashtag and keyword searches, so its view counts run high: compare the groups, not the absolute numbers.
Source: Revid TikTok index: 2,377,477 TikToks with AI labels per video, snapshot of Sep 15, 2026. Median views estimated from view buckets.
Show the data
| Median views | Share past 1M views | |
|---|---|---|
| Challenge | 226.9K | 32% |
| Comedy | 194.6K | 29.9% |
| Dance | 121K | 23.4% |
| Reaction | 117.4K | 23.4% |
| Tutorial | 111.5K | 22.2% |
| Storytelling | 107.7K | 21.5% |
| Lip Sync | 90.7K | 21.4% |
Social media report example
A summary written this way (replace the brackets with your numbers) answers the client's first questions in five lines:
[Month] summary. Views grew [X%] month over month, mostly from reels, which brought [X] of the [X] new followers. Link clicks rose [X%], and [X] leads came from social against a goal of [X]. Our weakest posts were static promos; our best were 30-second how-tos with the answer in the first line. Next month we will turn the top three how-tos into a series and cut static promos to one a week. We need your approval for [budget or asset].
Social media campaign report template
A campaign report covers one push (a launch, a sale, a seasonal campaign) from start to finish:
| Field | What to fill in |
|---|---|
| Objective and KPI | The one result the campaign was meant to move |
| Dates and channels | Start, end, platforms used |
| Budget | Planned and actual spend, ads and creator costs |
| Results vs target | Primary KPI, cost per result, revenue if tracked |
| Best and worst creative | Links, with the reason each won or lost |
| Learnings | What to repeat, what to drop |
8 tools that build social media reports for you
If you would rather not maintain a spreadsheet, these tools pull the data and generate the report. Prices and plan limits change often, so check each vendor's pricing page. For free report generators and analytics dashboards, see our roundup of social media analytics report templates.
| Tool | Best for | Data source |
|---|---|---|
| Looker Studio | Free, fully custom dashboards | Google connectors, Sheets, partner connectors |
| Buffer | Small teams that want simple analytics | Accounts connected to Buffer |
| Hootsuite | Teams already publishing through Hootsuite | Accounts connected to Hootsuite |
| Sprout Social | Presentation-ready and competitor reports | Accounts connected to Sprout Social |
| Agorapulse | Agencies tracking ROI and team performance | Accounts connected to Agorapulse |
| Sendible | Agencies sending white-label client reports | Client accounts connected to Sendible |
| HubSpot | Tying social to leads and deals | HubSpot CRM and Marketing Hub |
| Emplifi | Enterprise analytics and benchmarking | Emplifi's social suite |
Looker Studio (formerly Google Data Studio): free dashboards
Looker Studio, which Google renamed from Data Studio, is free and builds interactive, shareable dashboards. It connects natively to Google sources such as Google Analytics, YouTube Analytics, Google Ads and Google Sheets; data from Instagram, TikTok, Facebook or LinkedIn comes through partner connectors (often paid) or through the spreadsheet above. You can schedule a dashboard to arrive by email. Setup takes some technical work, and most data studio social media templates you find online still need your own connectors.

Buffer
Buffer's analytics show post-level and account-level performance for the channels you publish to through Buffer. It is the easiest of the eight to read, which suits solo creators and small businesses. Custom report options are more limited than in Sprout Social or Sendible.
Hootsuite
Hootsuite Analytics offers report templates across the networks you connect, custom metric selection and scheduled report delivery. It makes most sense if you already schedule posts in Hootsuite, since the data is already there. Reporting comes with a paid plan.
Sprout Social
Sprout Social's analytics produce presentation-ready reports, including profile, post and competitor reports, and can deliver them on a schedule. Advanced reporting sits on higher plans, and the interface takes longer to learn than Buffer's.
Agorapulse
Agorapulse reports cover engagement, audience growth, team performance (such as response times per team member) and ROI tracking for traffic from social. Reports export to PDF or CSV and can be scheduled, which suits agencies and in-house teams handling many profiles.
Sendible
Sendible is built for agencies: white-label reports with your logo and colors, multi-client management from one account and scheduled delivery to each client.
HubSpot
HubSpot ties social posts to contacts and deals in its CRM, so you can report leads and revenue from social instead of engagement alone. The social media tool in Marketing Hub requires a HubSpot subscription, so it fits teams already running HubSpot.
Emplifi (formerly Socialbakers)
Emplifi is an enterprise social suite with AI-driven insights and benchmarking against competitors and industries. It suits large brands and agencies with the budget and time for setup.
Which one to pick
- You already publish with Hootsuite, Sprout Social, Buffer or Agorapulse: use its built-in reports before buying anything else.
- You need free and custom: the spreadsheet template plus Looker Studio.
- You are an agency sending branded client reports: Sendible or Sprout Social.
- You need revenue attribution: HubSpot, or UTM links plus Google Analytics.
- You are an enterprise that needs competitor benchmarking: Emplifi.
Where Revid fits
Revid doesn't build reports; it makes the short-form videos your report measures. It turns an idea, a script or a link into a finished video and publishes it directly to TikTok, Instagram and YouTube. Every post published through Revid reports its views, likes and comments, and a post that did well can be remixed in one click, so the best posts in your report become next month's content. For a quick read on what works on a TikTok account before you build the report, run the free TikTok account audit.
FAQ
How often should you send a social media report?
Monthly is the standard for clients and leadership, because it smooths out day-to-day noise. Add a quick weekly check of top posts for the team and a quarterly review for strategy and budget.
Can social media reports be automated?
Yes. Hootsuite, Sprout Social, Agorapulse and Sendible can send scheduled reports, and Looker Studio can email a dashboard on a schedule. You still write the summary and insights yourself; publishing can be automated too (see how to automate social media posts).
Does Sprout Social provide ROI reporting templates?
Sprout Social includes ready-made reports in its analytics, but which ones you get depends on the plan, so check the current plan comparison on Sprout Social's site. For revenue-based ROI, any tool needs conversion data from UTM links in Google Analytics or from a CRM.
Is there a media inquiry log template that tracks reporter, outlet, deadline, owner and response status?
Yes, and a spreadsheet is enough: one row per inquiry with columns for date received, reporter, outlet, topic, deadline, owner, response status (new, in progress, answered, declined) and notes. Keep it as a separate tab next to your communications calendar rather than inside the social media report.
Sources
- Revid analysis of 123,704 English-language TikToks with 1,000+ likes posted between Oct 1, 2025 and Oct 16, 2026
- Revid TikTok index: 2,377,477 TikToks with AI labels per video, snapshot of Sep 15, 2026. Median views estimated from view buckets.
- Socialinsider, TikTok vs. Reels vs. Shorts: 2026 Engagement Data (August 2026)
Charts and figures checked on November 6, 2026.